VEGF and VEGFR2 immunofluorescence optimization
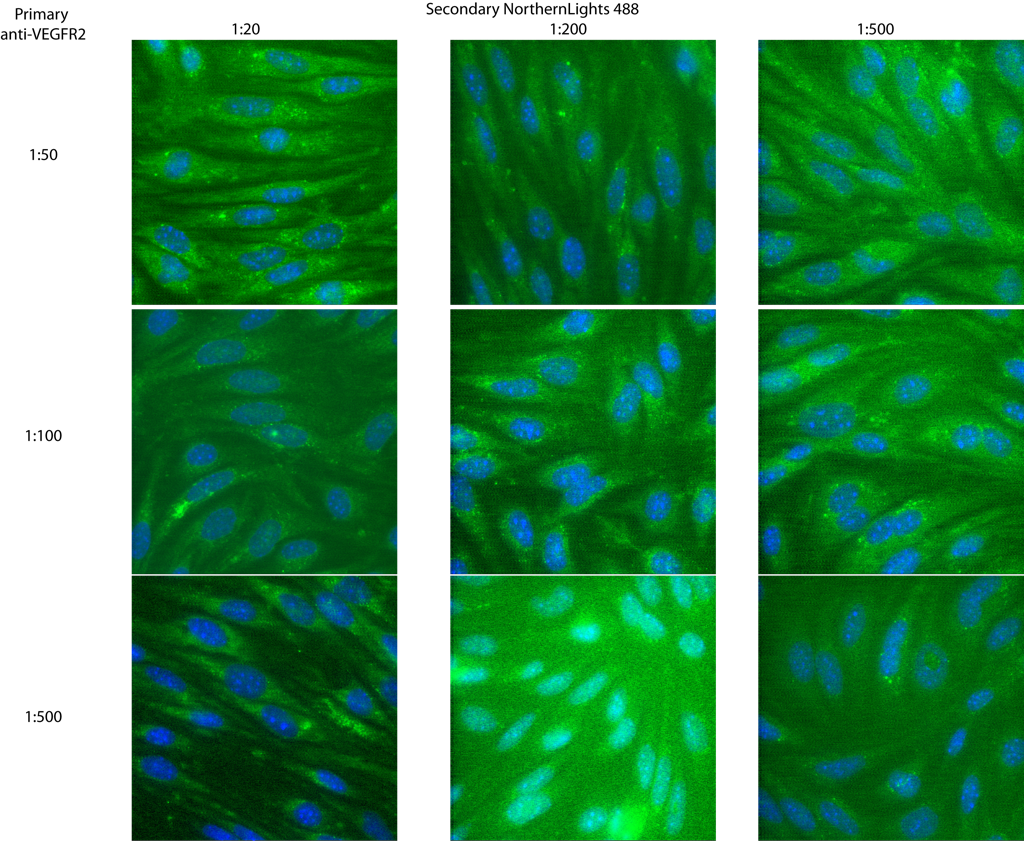
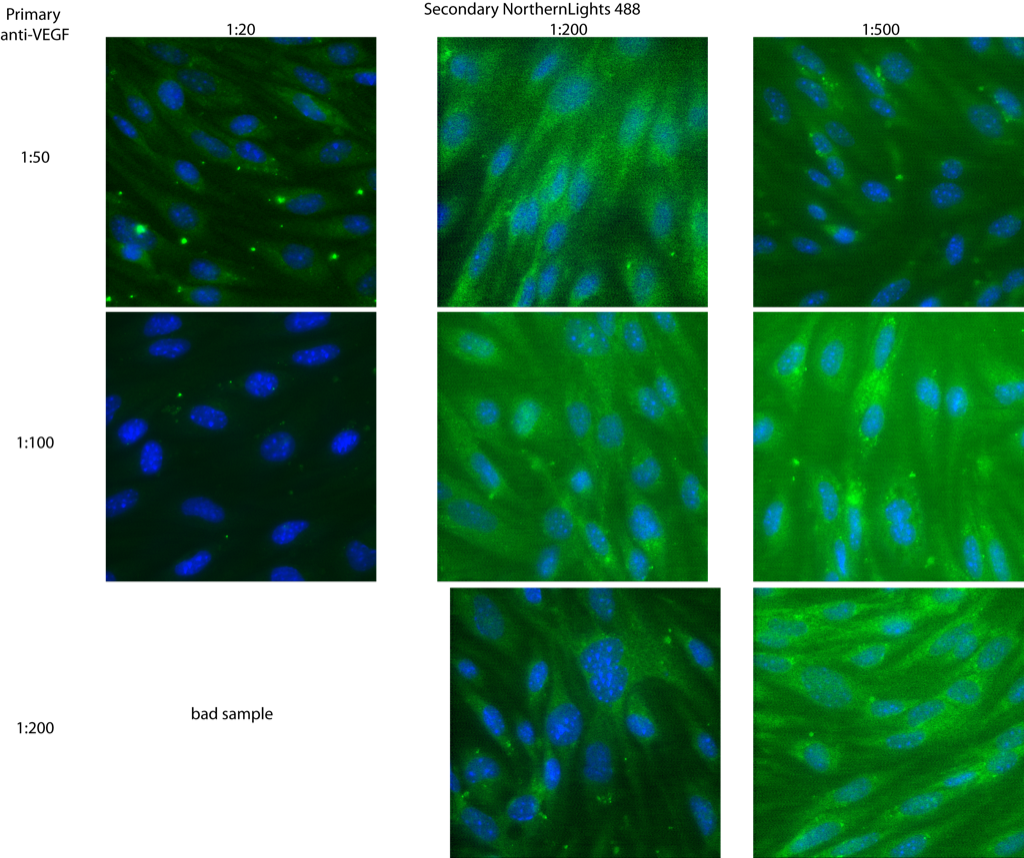
Vascular endothelial growth factor (VEGF) is one of the important growth factors/signaling factors that affect endothelial cells. It is involved in angiogenesis, vessel regrowth during wound healing, vessel development and other vascular functions. Since this is the most commonly studied growth factor in in vitro angiogenesis assays, I’ve been thinking about it for awhile. If vacuole formation on pnc-Si membranes indicates the first step toward tube formation, are bEnd cells on pnc-Si membranes overexpressing VEGF (and/or its receptors) in order to recruit more cells to the membrane window and initiate tube formation? One way to answer that question is to stain for VEGF and its receptors using immunofluorescence. The first step toward these experiments is to try to optimize the staining specificity and brightness by altering the concentrations of primary and secondary antibodies. I bought monoclonal antibodies against soluble VEGF (isoforms 121, 165 and 189) and VEGFR2 (the best characterized VEGF receptor). Therefore, the VEGF Ab should pick up changes in VEGF expression and the VEGFR2 Ab should pick up changes in receptor expression on cell surfaces – both possibilities on vacuolized cells. This experiment was done with P12 bEnd seeded at 50000 cells/cm2 on glass coverslips and grown for 11 days. Based on literature data, I chose 1:50, 1:100 and 1:200 dilutions for primary mVEGF and 1:50, 1:100 and 1:500 primary VEGFR2. The secondary concentrations were the same for both primaries – 1:20, 1:200 and 1:500. Secondary antibodies were conjugated with Northern Lights 493nm dye (similar to Alexa) to fluoresce green. I followed the protocol called ‘double immunofluorescence’ on the protocols page with counterstained nuclei.
For VEGFR2, it looks like 1:50 primary with any secondary concentration and 1:100 primary with 1:200 or 1:500 secondary gave decent results. VEGFR2 expression seems to be perinuclear (punctate spots around nucleus), although it does spread away from the nucleus in some cells, with some background staining throughout. I will probably pick a middle of the road concentration here – probably 1:100 primary and 1:200 secondary.
The soluble VEGF expression was a bit different – there were also puncta of green but it seems like they tended to be distributed a bit further from the nucleus. It seems like either of the primary concentrations and 1:500 for secondary gave the best results, so I’ll be safe and stay with 1:100 for the primary and 1:500 for the secondary.
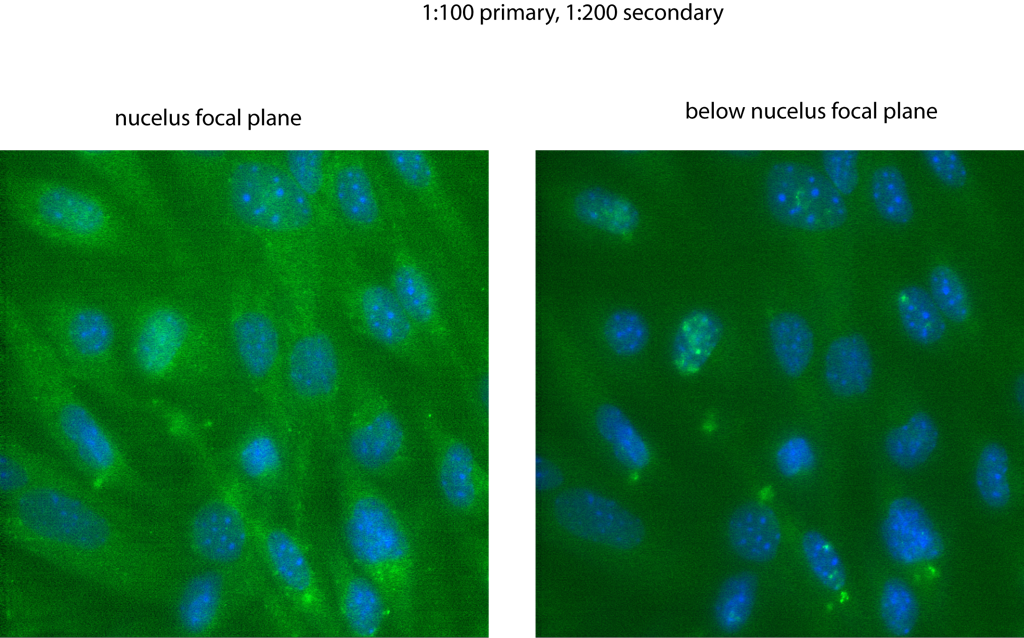
As I imaged the cells stained for VEGF, I noticed definite 3D distribution of staining that I didn’t notice for VEGFR2 (when I changed focus, puncta came in and out of focus). The bottom figure shows the ‘normal’ focal plane with the nuclei in focus. I then changed the focal plane slightly above the nuclei (forgot to check the z-distance) and took the right image. Some puncta have totally disappeared and some have come into focus – many of them right above the nuclei.
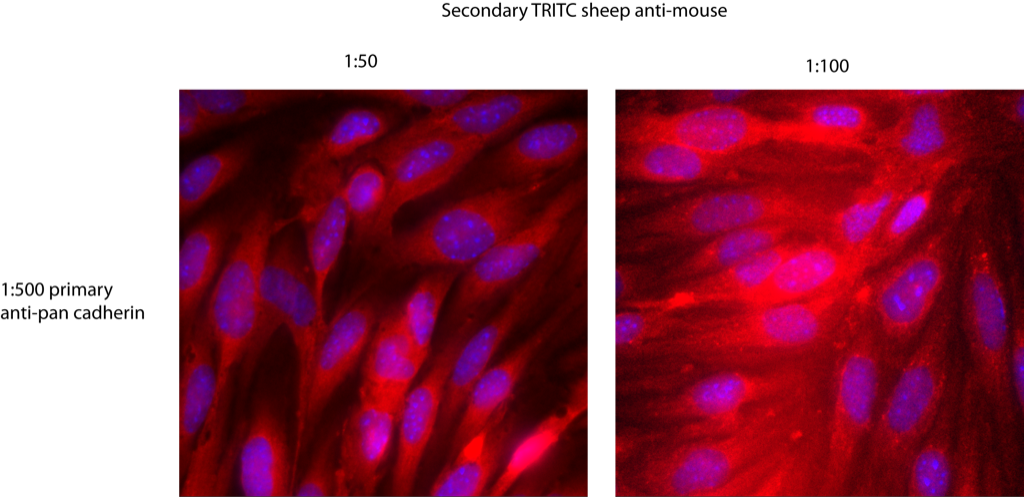
As a control, I also stained a couple of coverslips for cadherins (cell-cell junction proteins) with a primary pan-cadherin antibody. Although cadherins are typically associated with intercellular junctions, these images are representative of previous cadherin images I’ve done. Importantly, the distribution of staining is markedly different than that of VEGF and VEGFR2, so the VEGF results are simply non-specific staining.
In conclusion, I’ve got some optimized antibody concentrations. Now I need to optimize the staining protocol (permeabilization methods, incubation times, etc.) and then I can move onto pnc-Si samples.