
Review of nanoparticle-based CAD-IA trials up to date
Introduction
As we’ve been trying for nanoparticle-based CAD-IA for multiple trials, we have tested various reaction routes, reaction conditions, and antibody pairs with 3 different nanoparticles. Here, I would like to take a step back to go through the CAD-IA stories based on different nanoparticles.
CAD-IA based on different nanoparticles
Fluorescent SA-modified magnetic particles
- Physical and chemical properties Dragon green fluorescent particles with magnetite core (d.nm ~ 100) are functionalized with streptavidin for biotin interaction and a crosslinked hydroxyethyl starch shell.
- General reaction route 2*10^7 nanoparticles were incubated with 0.02 uM biotinylated capture ab for 1 hr in the tube. Then, nanoparticles were washed and incubated with solvent that incorporate 0.5 uM detection ab with Alexa fluor 647 labelled (fluorescent red) and 679.5 pg/ml GFAP for 2 hrs in the tube. Washing of nanoparticles from unreacted reagents is achieved by pulling magnetic nanoparticles with a magnet. Imaging of the nanoparticles & immunocomplexes is achieved by using the NPN to capture ~ 4*10^5 particles under the confocal microscope (Fig. 1A).
- Results and conclusions For the device under confocal microscope, we saw giant aggregations in the green channel and uncolocalized red dots in the red channel (Fig. 1B). As naked magnetic nanoparticles appeared to be identical in size (Fig. 1C), the giant aggregations in the green channel suggested that magnetic particles were aggregated because either surface properties changed during the labelling of antibodies and antigens, or the washing strategies of pulling magnetic particles by magnet. The uncolocalized red dots on the other hand suggested a failure of detection antibody targeting to the beads. This might result from the failure of any reagents targeting steps during the CAD-IA. Considering only 25~33 SA were modified in each particle, the low efficiency of capture ab conjugation might have became a trouble at the first place. We also found that the particles are not bright enough to be vividly characterized by the confocal. Hence, we started to look for better reaction routes and brighter nanoparticles with more SA on the surface.

Fig. 1A. General reaction route of CAD-IA based on fluorescent SA-modified magnetic particles.
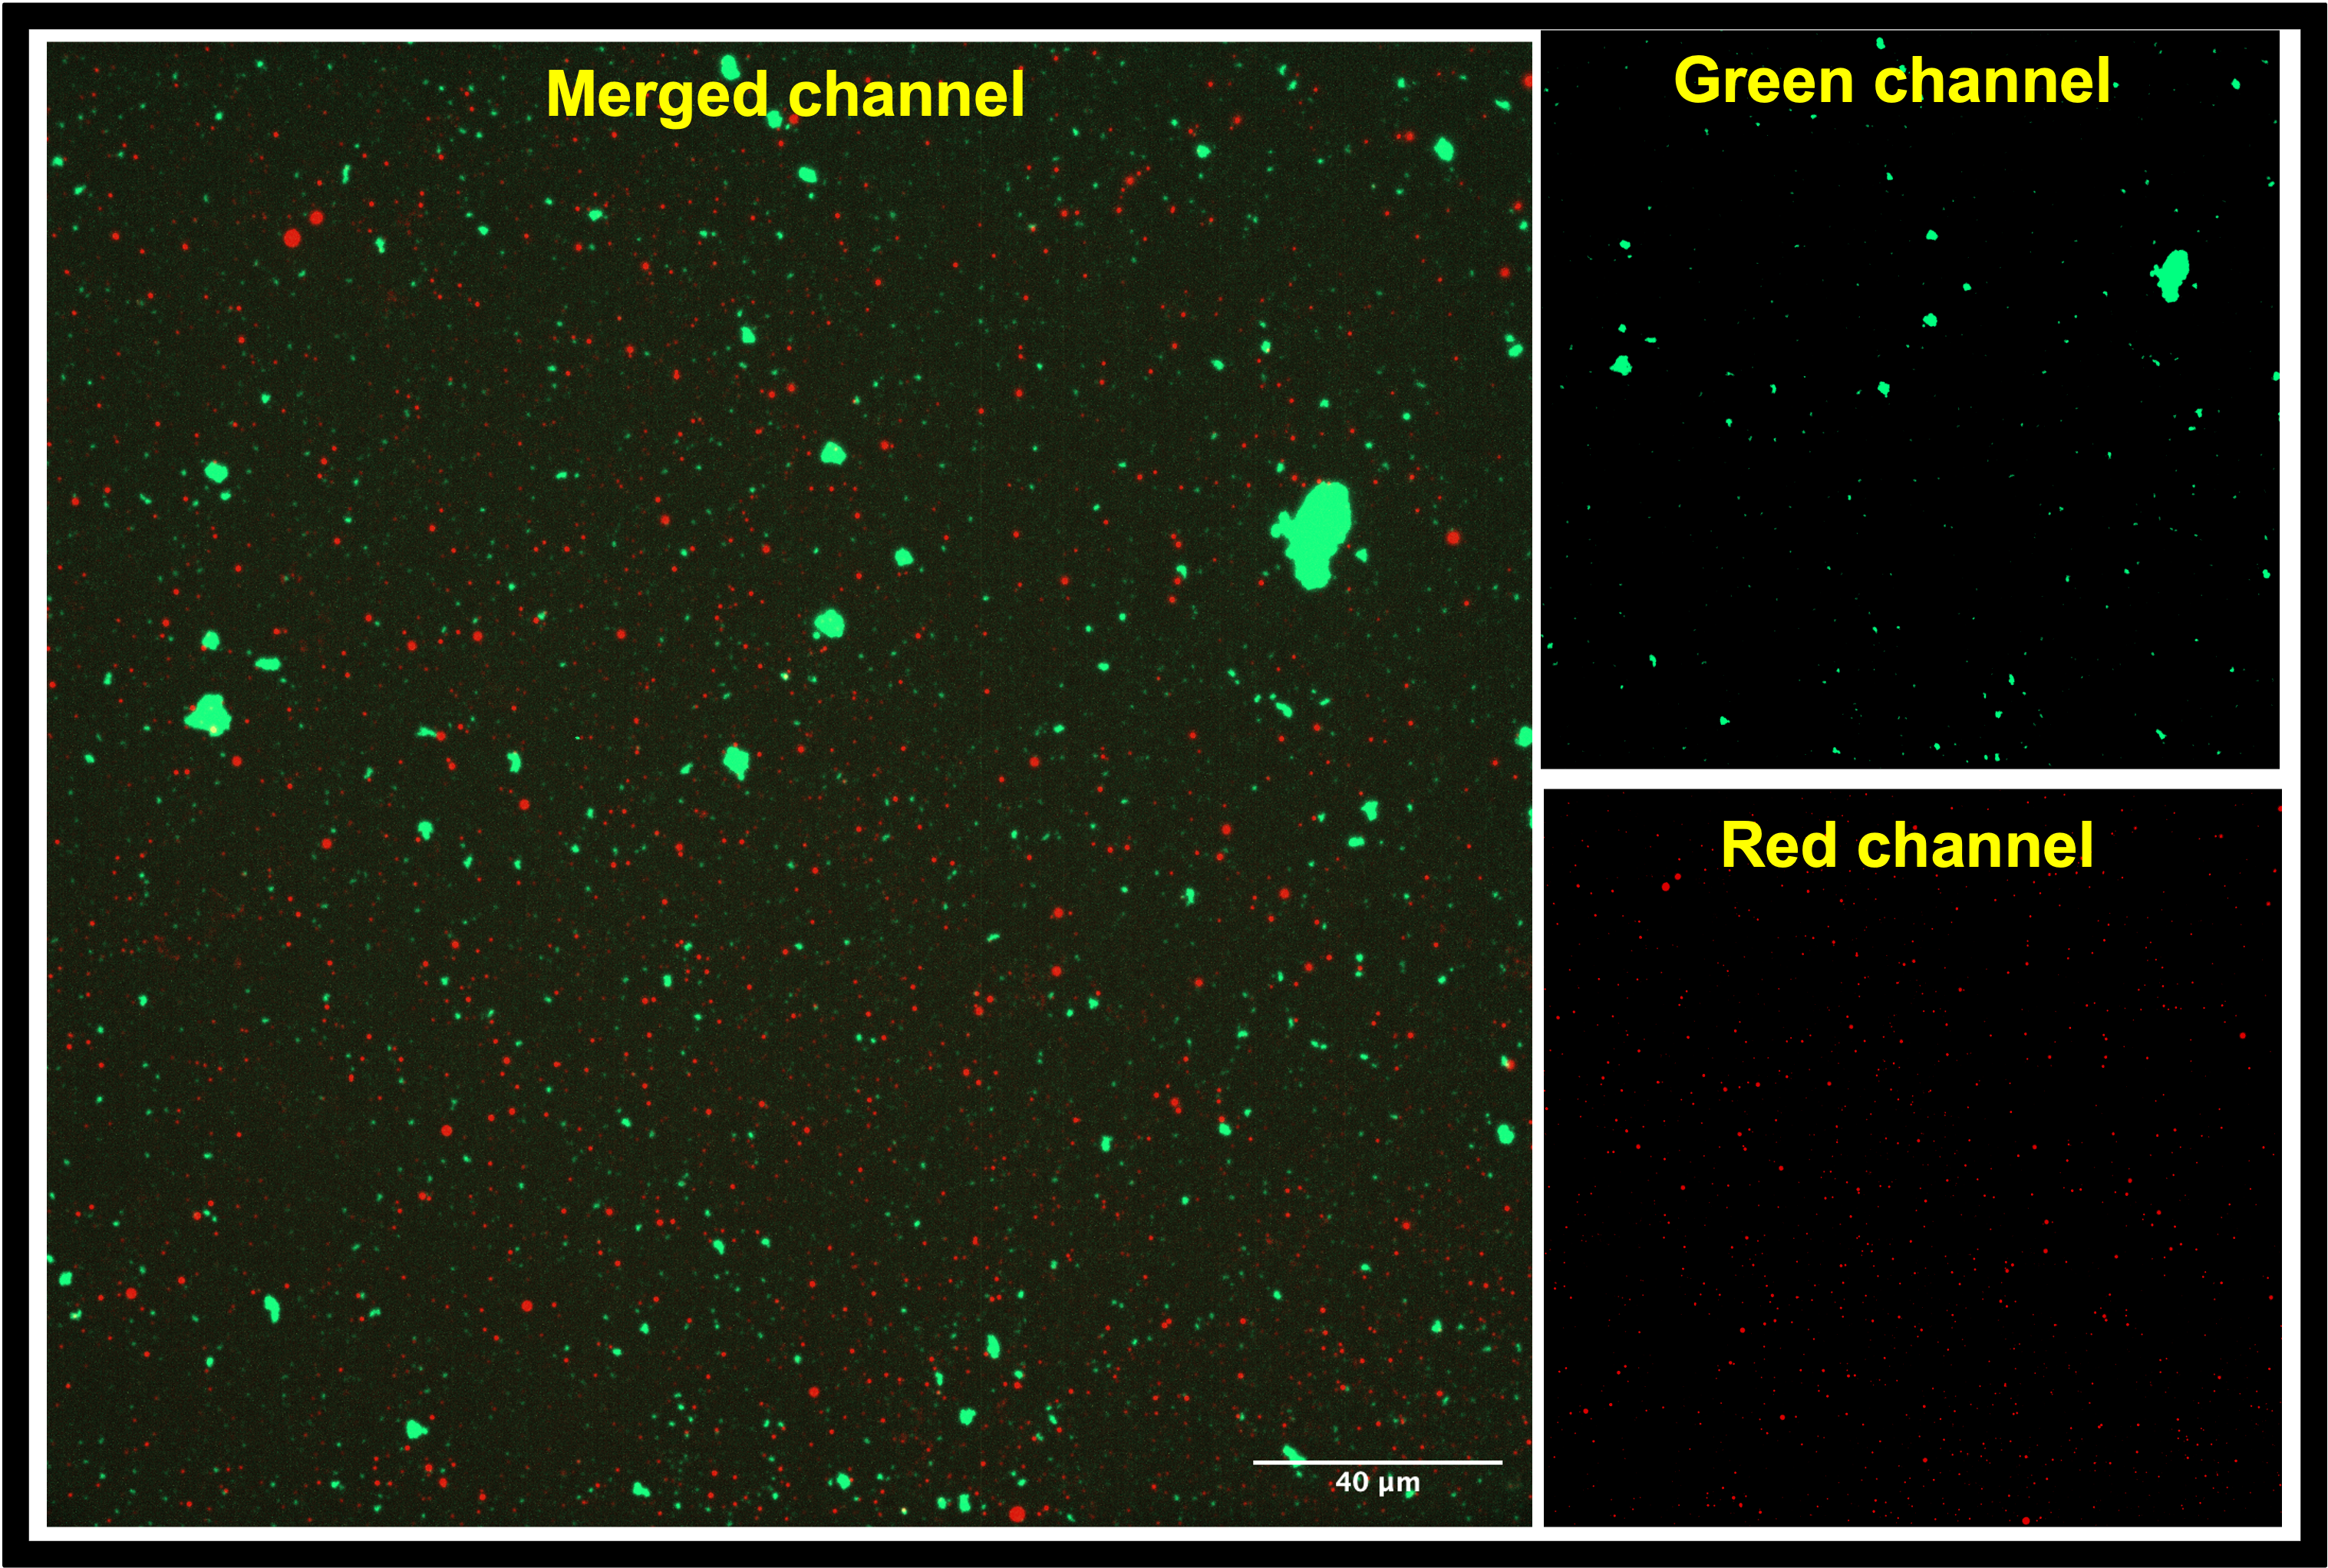
Fig. 1B. CAD-IA based on fluorescent SA-modified magnetic particles with GFAP ~ 679.5 pg/ml.
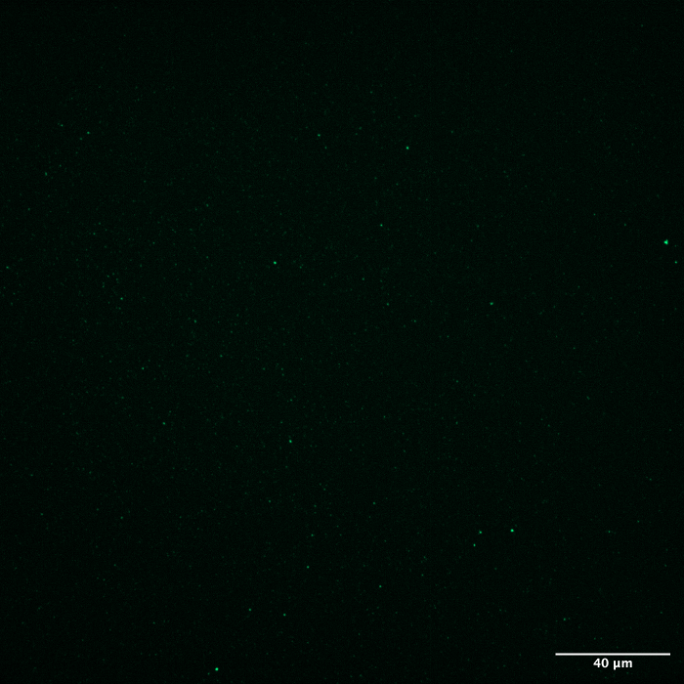
Fig. 1C. Naked fluorescent SA-modified magnetic particles.
Fluorescent SA-modified PS particles
- Physical and chemical properties Dragon green fluorescent polystyrene particles with streptavidin coated on the surface for biotin interaction (d.nm~200). This polystyrene nanoparticle is way brighter than the magnetic nanoparticle with hundred times more of streptavidin modified on the surface (~8126 biotin in each particle).
- General reaction route Besides the dramatic increases of fluorescent signals and number of functional groups for conjugation, better reaction route to avoid nanoparticle and protein aggregations are generated here. Since multiple reactive centers could be appear in both the antibodies (biotins) and the nanoparticles (streptavidins), we use the NPN to capture ~10^6 NPs before the labeling of capture antibody. This could potentially help us avoid the aggregations of nanoparticle by cross-linking via biotin-streptavidin interactions or change of surface hydrophobicity after labeling. Then, biotinylated capture antibody (2 ug/ml), GFAP, and Alexa fluor 647 (0.5 ug/ml) labelled detection antibody were added in orders, with 2 hrs reaction period for each reagents. 3 times of washing were conducted to remove unreacted reagents after each step of reaction (Fig. 2A).
- Results and conclusions As we use the NPN to capture nanoparticles prior to the reactions, nanoparticles appear to be identical with less aggregations (Fig. 2B). We conducted a CAD-IA assay with series of GFAP concentrations from (0.07~3.5 ng/uL) and a GFAP negative control (Fig. 2C). However, though we found that all the GFAP positive groups have higher signals to the GFAP negative groups, there was an inconsistency of signal intensities vs GFAP concentrations within the range of 0.07~2.4 ng/uL as they fluctuate within the co-localization percentage of 2~5%. This might result from either hindered binding domains of the capture antibody or steric hinderance of highly saturated beads surface which leads to the poor targeting of GFAP to capture antibody. In addition, as we surprisingly found the GFAP dose-dependency achieved by non-specific sticking of GFAP to the beads (CAD-IA (ns), see the post on 2024.4.10), non-specific binding of antibodies & antigens could be another concerns to the dose-dependency of CAD-IA. Hence, we strive to find an alternative nanoparticle for better binding domain exposure of antibodies and reduce non-specific binding of reagents.
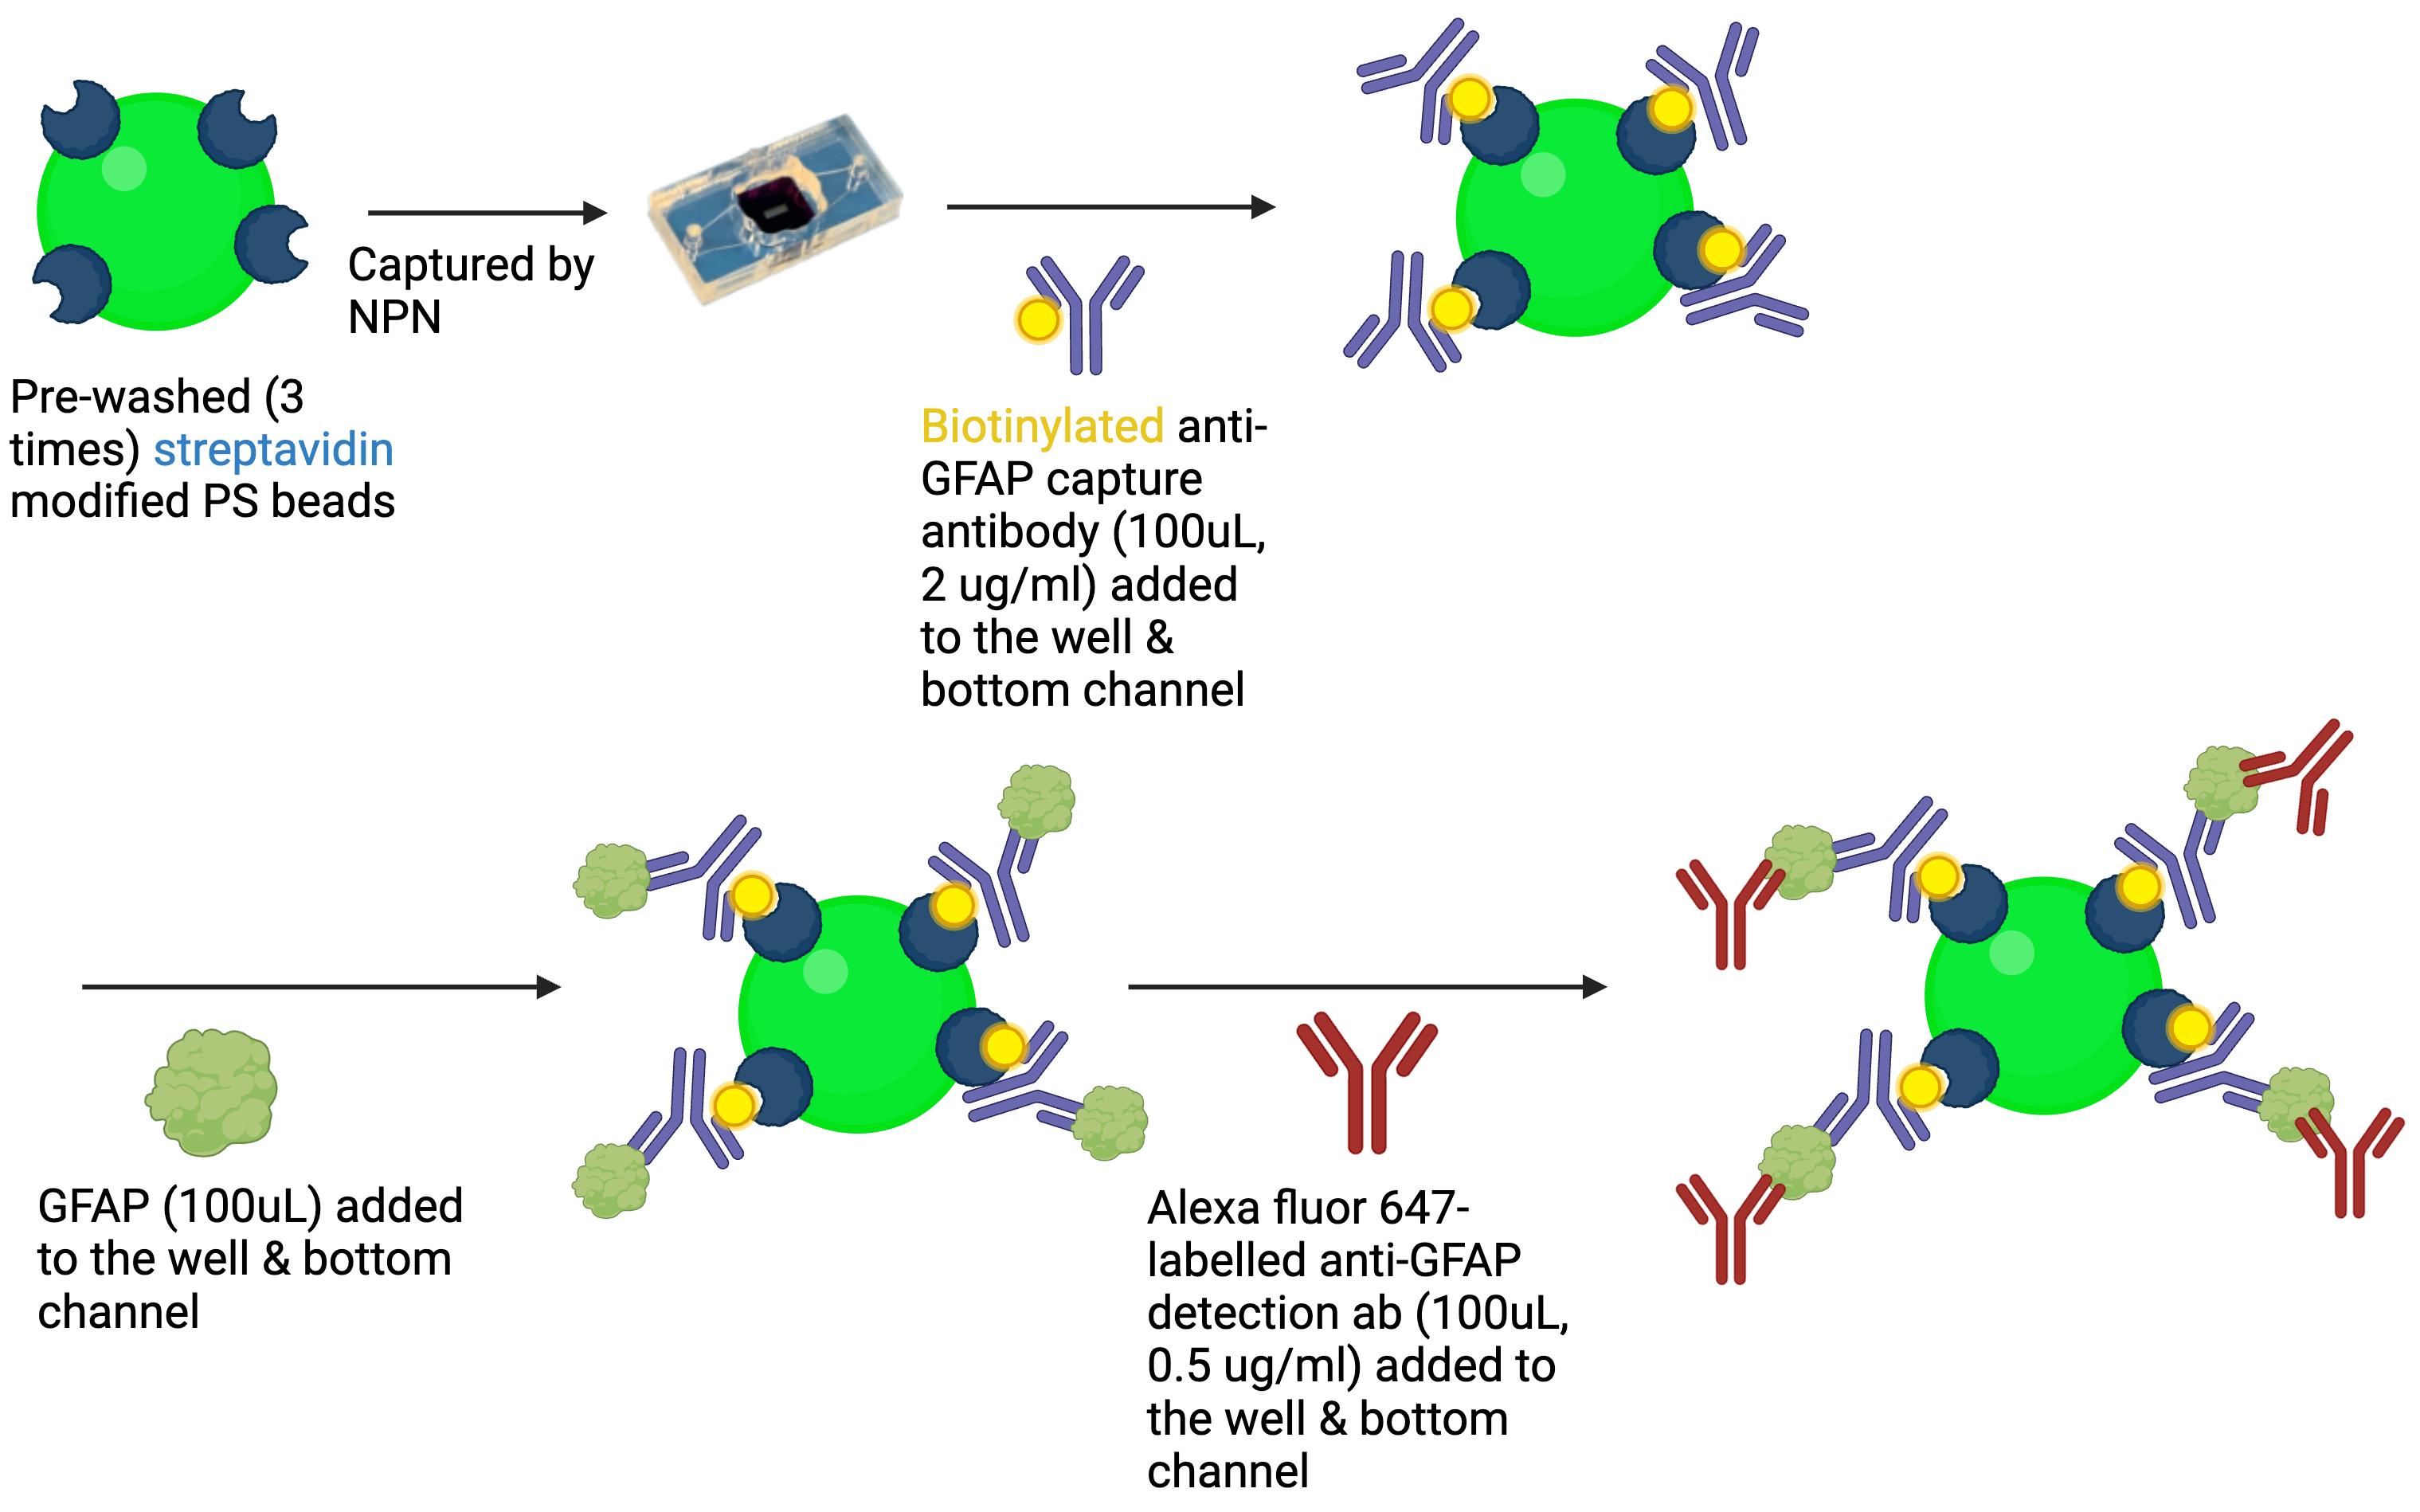
Fig. 2A. General route of CAD-IA based on fluorescent SA-modified PS particles.
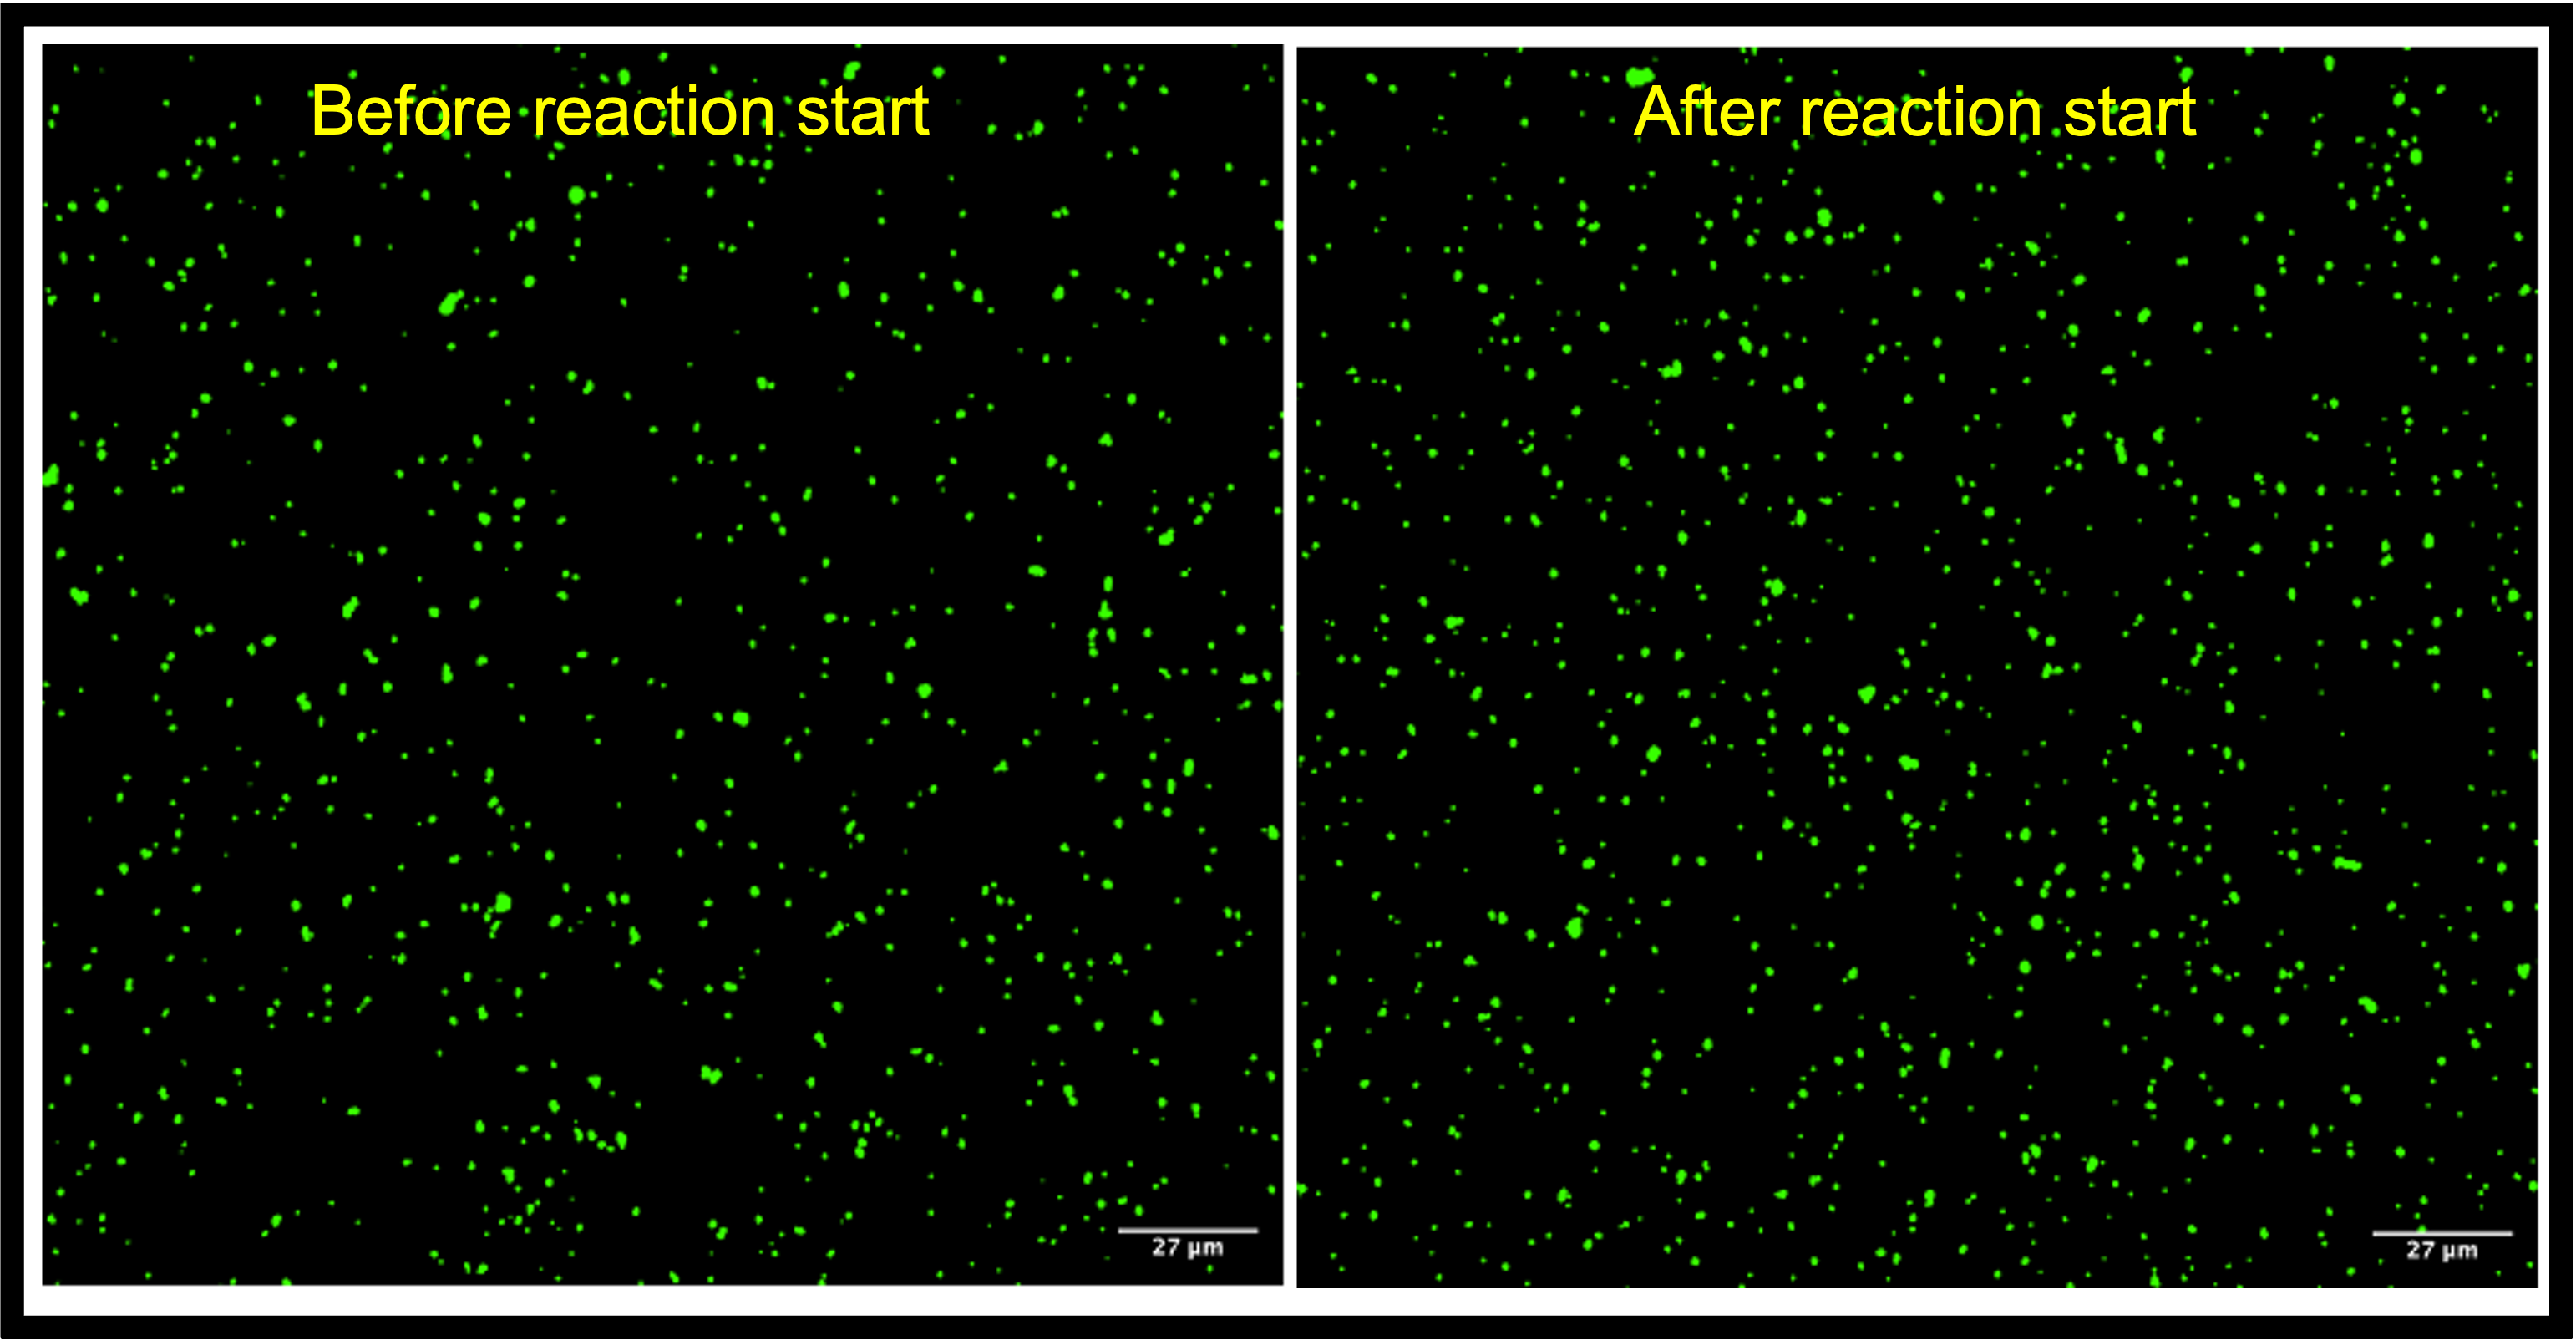
Fig. 2B. Images of uSiM before vs after reagents added. NPs appeared to be less aggregated by NPN capturing regardless of changes in surface property by antibody & antigen targeting.

Fig. 2C. CAD-IA based on fluorescent SA-modified PS particles.
Fluorescent protein G-modified AuNPs with PEG spacers
- Physical and chemical properties AuNPs with Alexa fluor 488 & protein G modifed on the surface for the binding of igG (d.nm~200). Both the fluorochromes and the protein G are linked to the surface of the particles by a 2 kDa PEG spacer. As the protein G is distanced from the core of nanoparticle by a PEG spacer, the antigens binding to the protein G are supposed to be more directionally identical for less hinderance for GFAP targeting and there should be less non-specific binding of reagents. The binding capacity is 4334 antibody / nanoparticle.
- General reaction route Since the protein G modified nanoparticle not only bind the capture antibody but the detection antibody, we kept most of the reaction steps the same as ones for the fluorescent SA-modified PS particles. Here are several changes we made, 1) we replaced the biotinylated capture antibody with Alexa fluor 568 labelled capture antibody for characterization of the sandwich immunocomplexes, 2) we tried different concentrations of the capture ab (2 ug/ml, 4 ug/ml, and 10 ug/ml) to investigate the point of protein G saturation since it might lead to false positive signal by detection antibody binding to active protein G, 3) we tried different concentrations of detection antibody (0.5 ug/ml and 2 ug/ml) since the AuNPs could potentially quench the fluorochromes that might need brighter signals to be detected.
- Results and conclusions It was frustrated that the AuNPs are not able to be fluorescently characterized as Alexa fluor 488 molecules are too close to them. We can still see the AuNPs under bright field light but the Fiji is not able to accurately count the number of AuNPs. For the validation of protein G binding ability, we imaged the uSiM after capture antibody conjugation step and we saw almost all the AuNPs observed in the bright light channel are colocalized with the dots observed in the orange channel (Fig. 3A). For the CAD-IA, we conducted GFAP negative (GFAP = 0) vs GFAP positive (GFAP~3.6 ng/uL) with 3 trials using different combinations of capture antibody and detection antibody concentrations, 1) 2 ug/ml capture and 0.5 ug/ml detection, 2) 4 ug/ml capture and 2 ug/ml detection, and 3) 10 ug/ml capture and 2 ug/ml detection. For trial 1) (Fig. 3B), we found that the dots in the orange channel became dimmer than the ones before GFAP labelling, which might caused by the fluorescence resonance energy transfer of Alexa fluor 568 to Alexa fluor 647. We also found very few red dots for GFAP positive, which might caused by either poor targeting of GFAP or low concentration of detection antibody. However, as we increase both the capture antibody and detection antibody as trial 2) (Fig, 3C), almost all the beads are lighted up with detection antibody for both the GFAP positive and GFAP negative. As we know the detection antibody has great non-specific binding resistance to either the capture antibody or the surface of the beads, this phenomenon was very likely caused by detection antibody binding to active protein G. This false positive was not alleviated even when we have extremely high capture antibody concentration that has ~1000 times more antibody than the binding capacity of the bead in trial 3) (Fig. 3D). As protein G is not specifically bind to capture antibody, we might still need to switch back to specific conjugation and countable fluorescent nanoparticles.
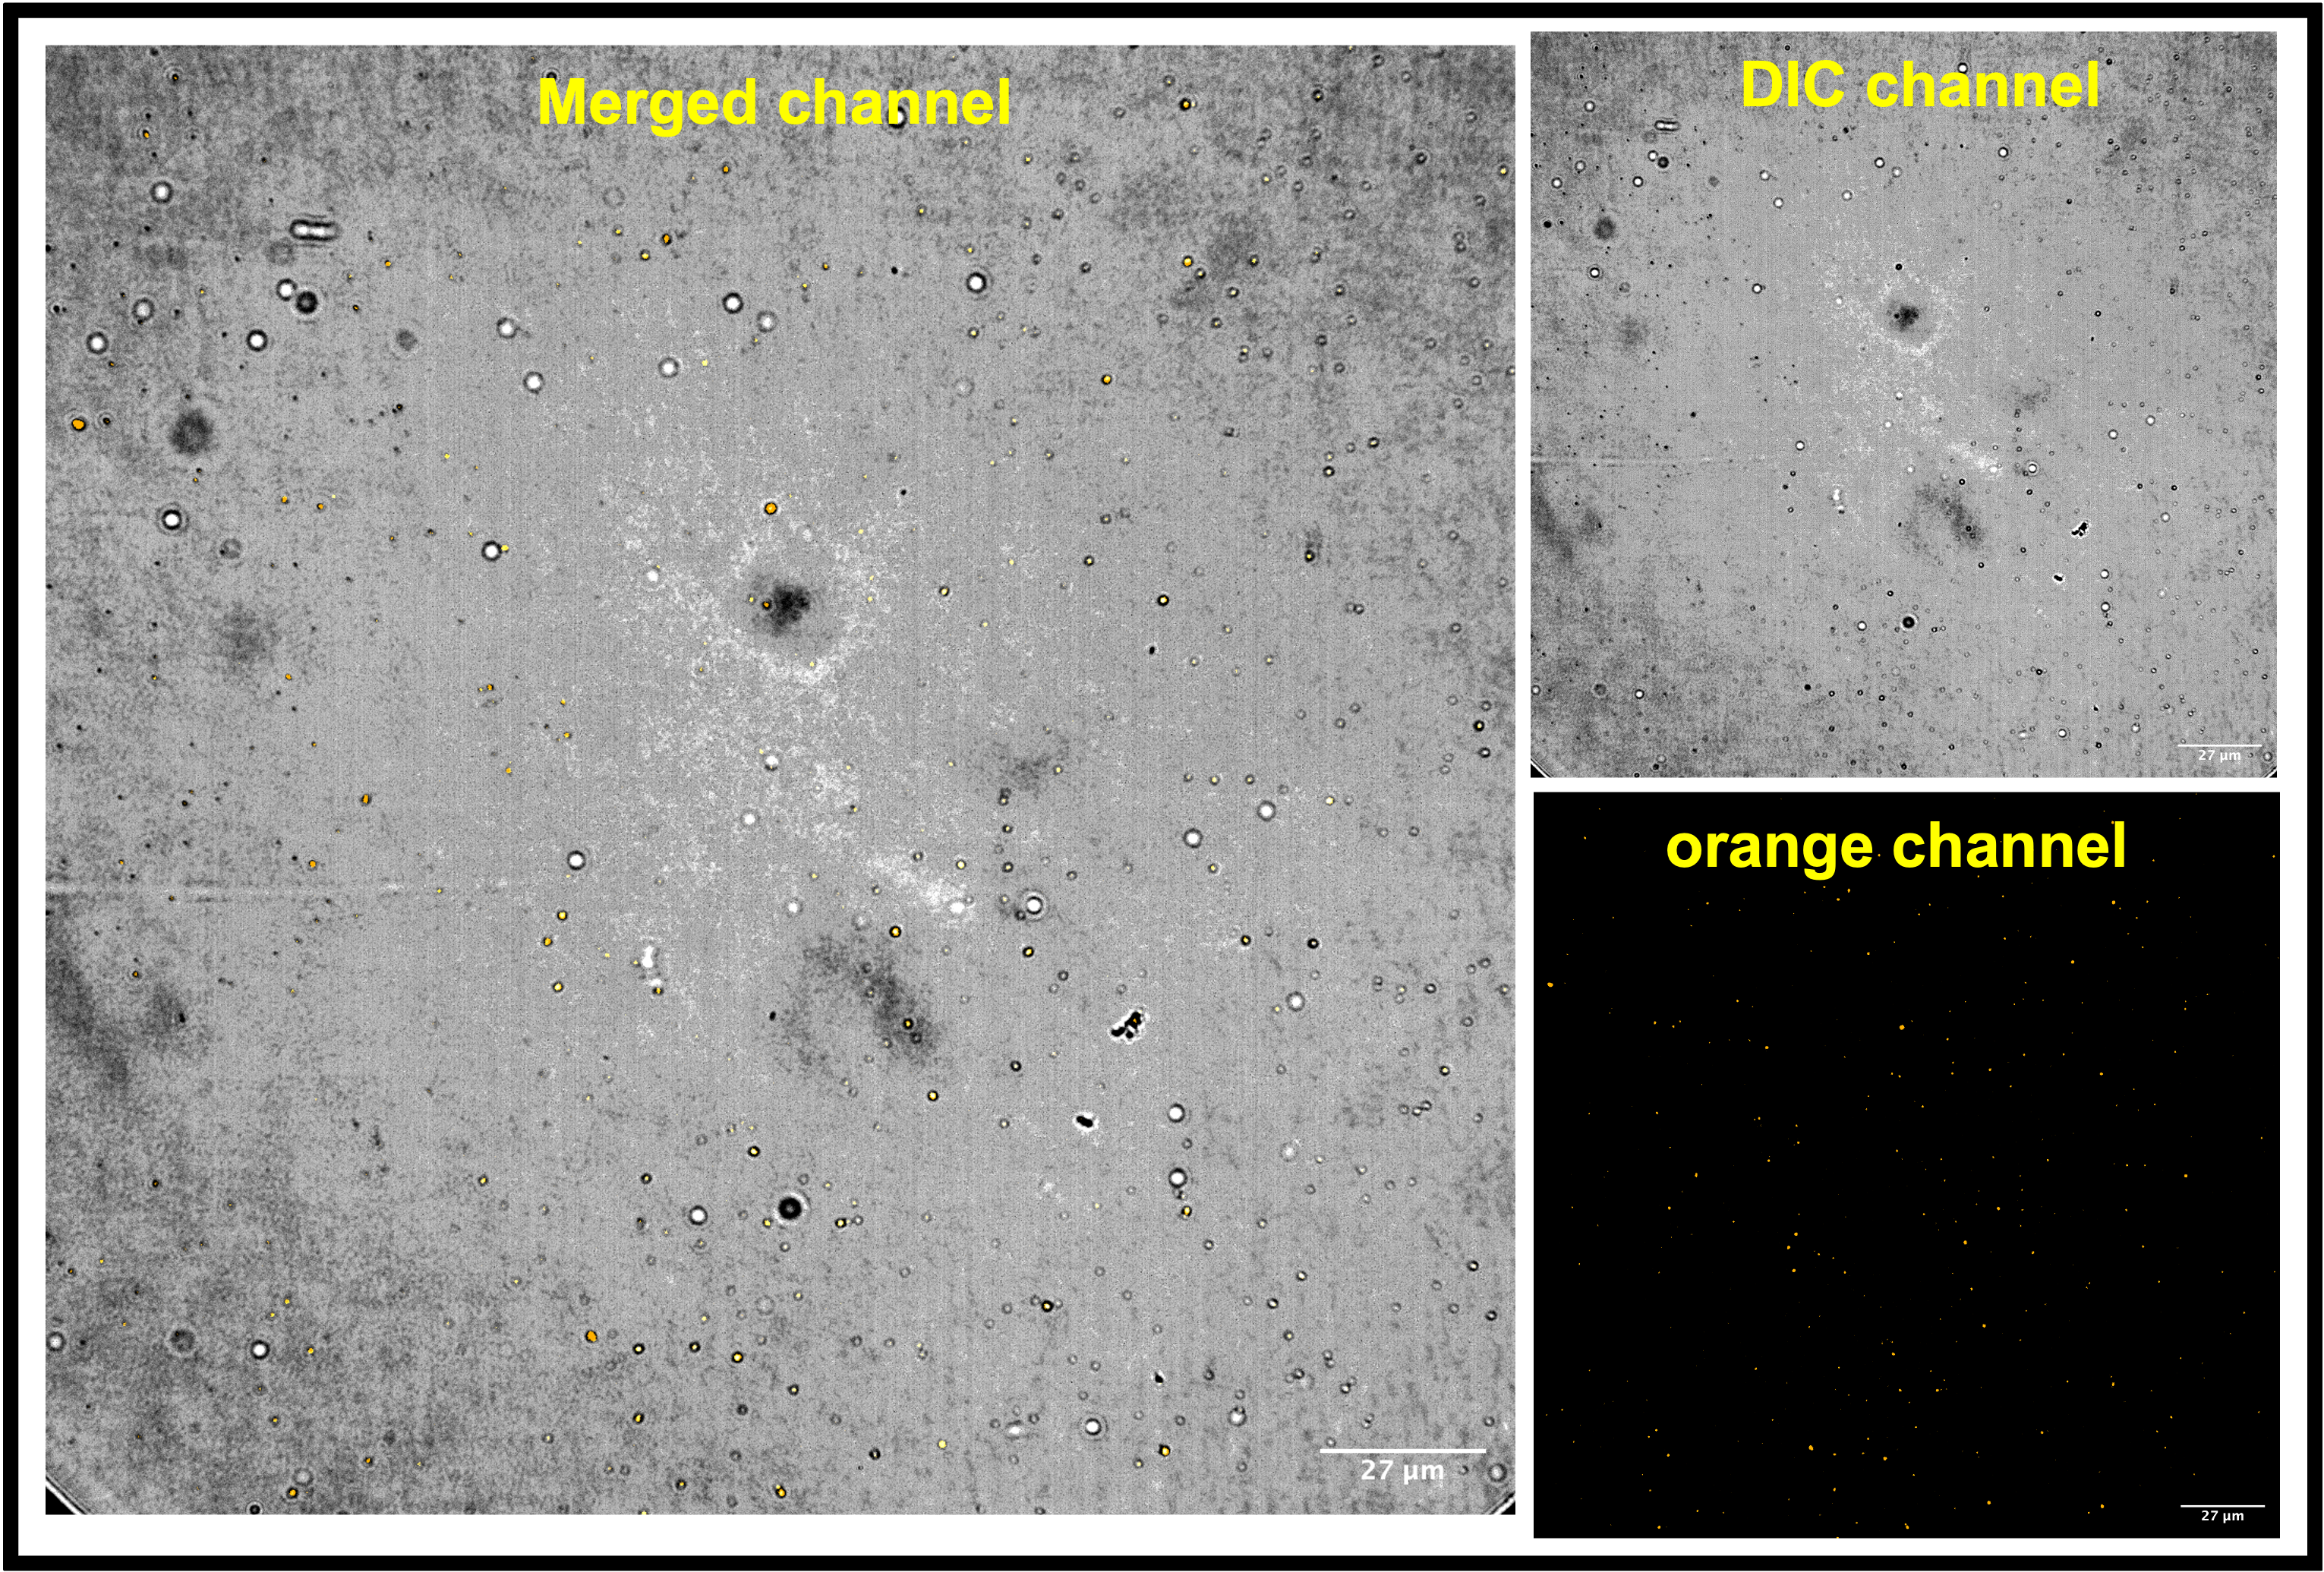
Fig. 3A. Images of uSiM after Alexa fluor 568 labelled capture antibody conjugation step completed. Almost all the AuNPs are conjugated with capture antibody observed by naked eyes.
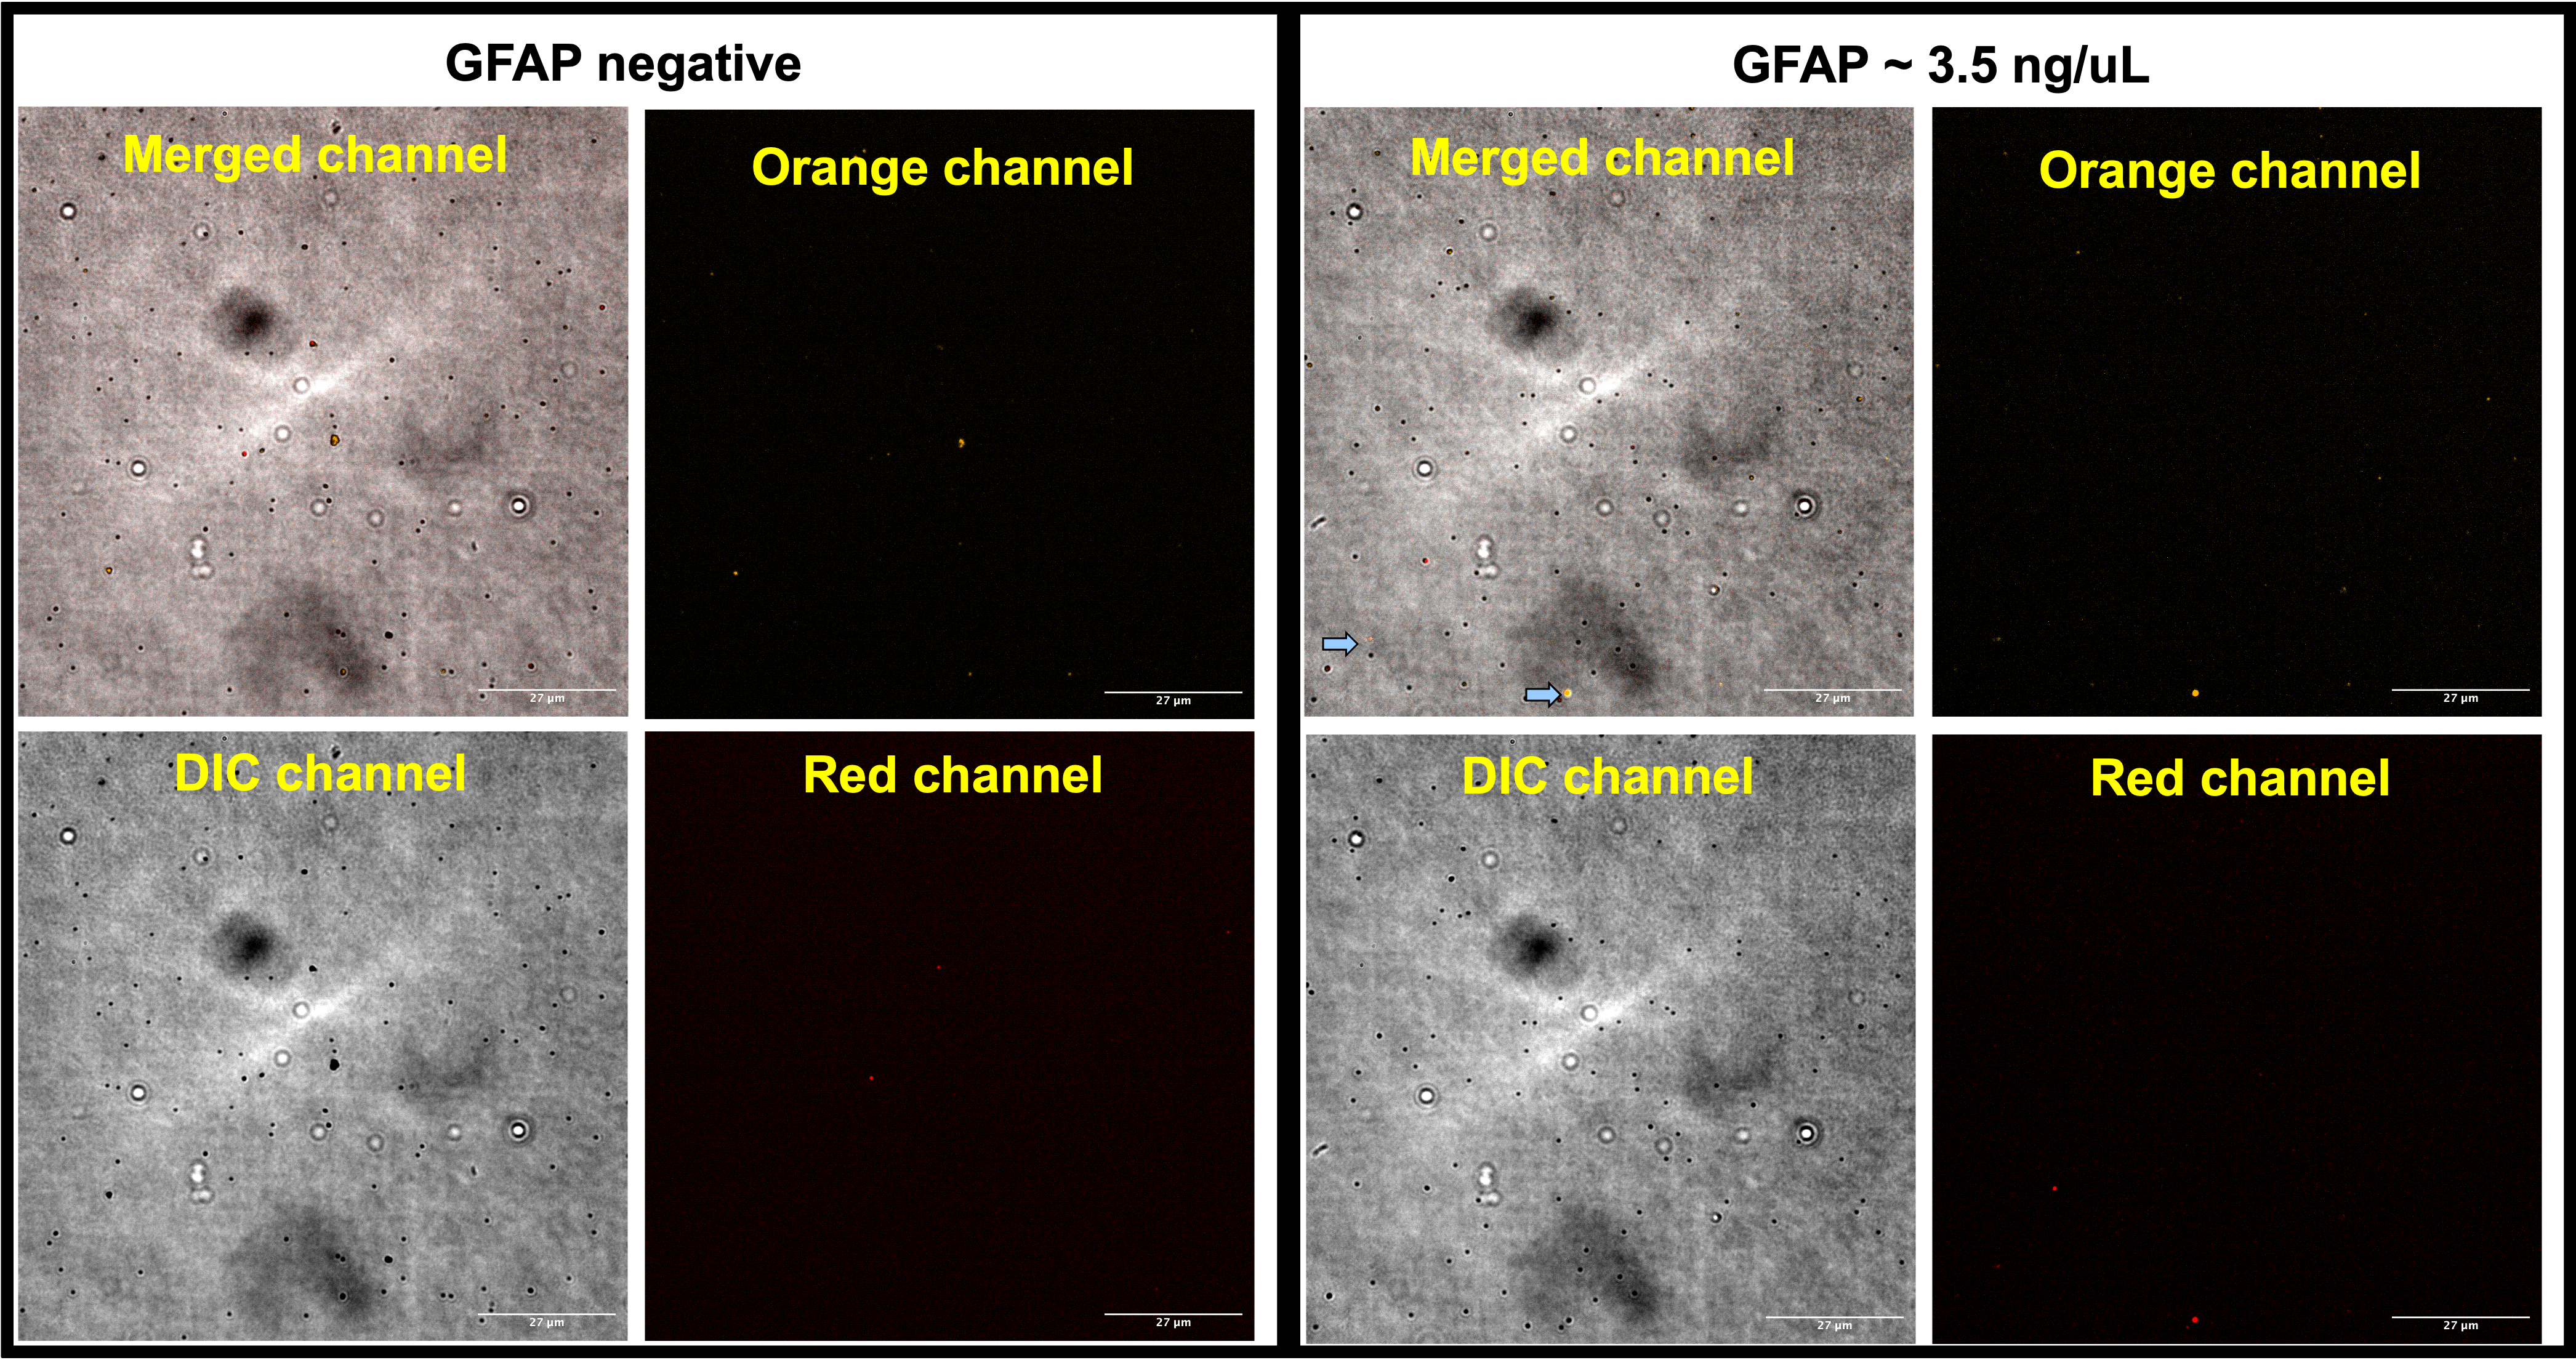
Fig. 3B. Trail 1) of CAD-IA based on protein G-modified AuNPs with PEG spacers: 2 ug/ml capture antibody & 0.5 ug/ml detection antibody. Few AuNPs were lighted up with detection antibody.
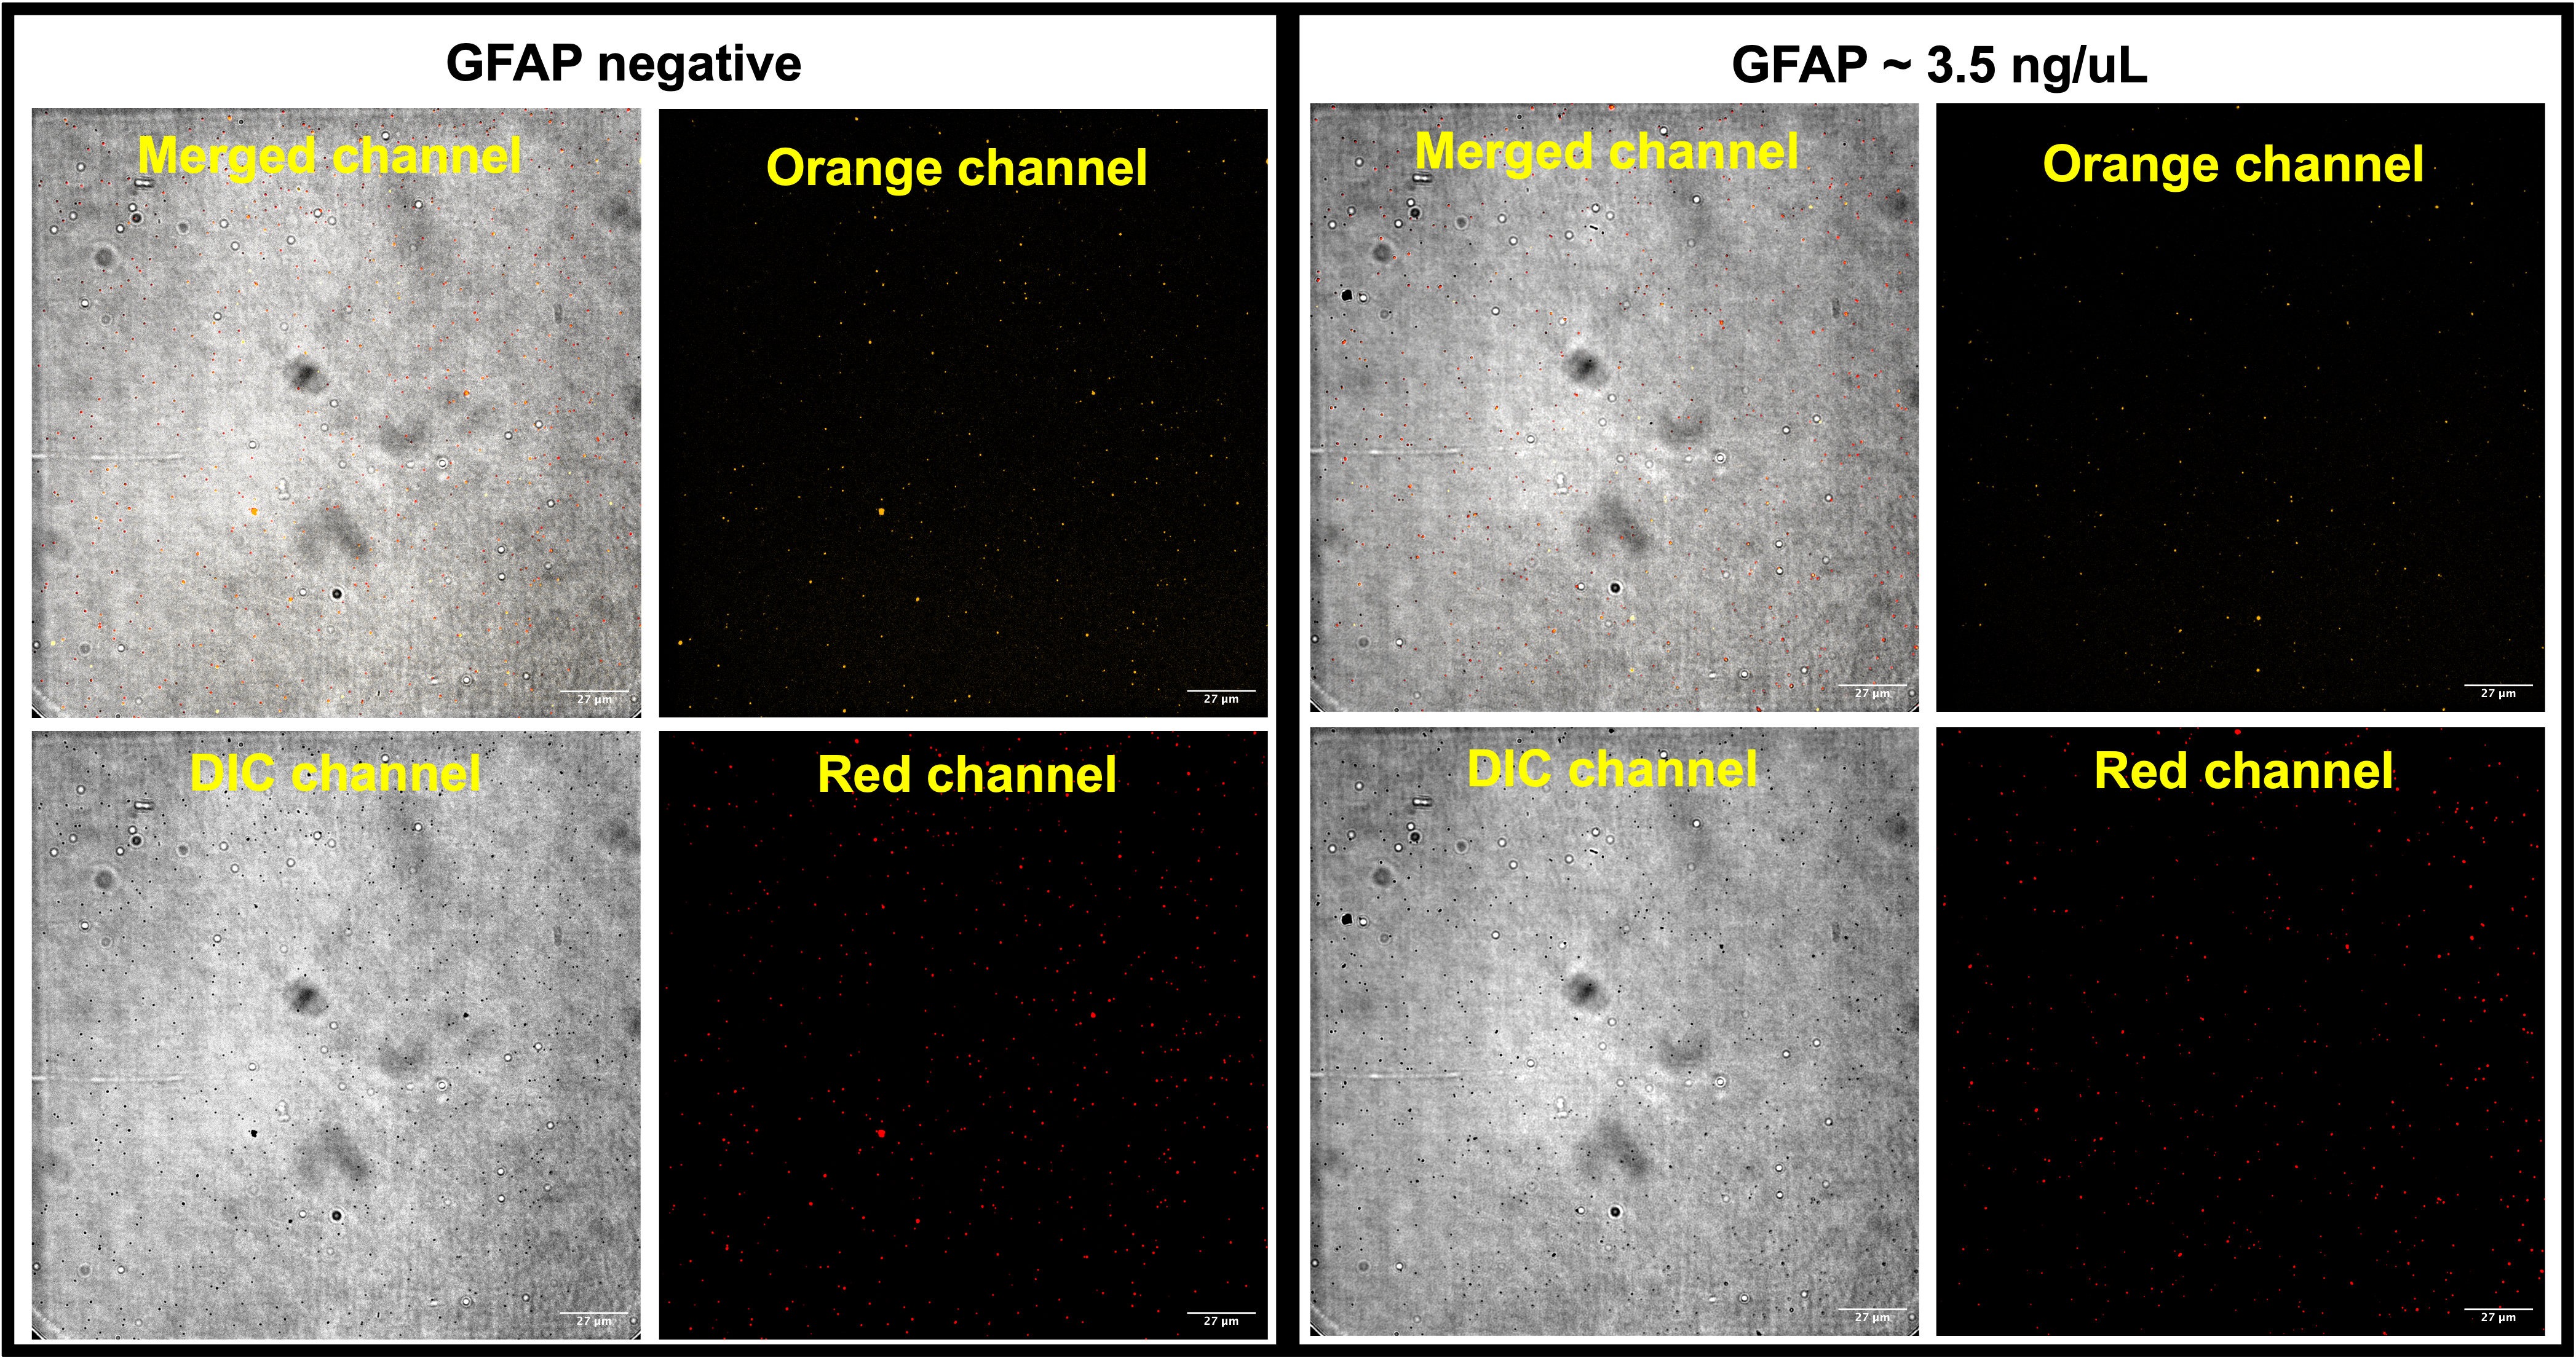
Fig. 3C. Trail 2) of CAD-IA based on protein G-modified AuNPs with PEG spacers: 4 ug/ml capture antibody & 2 ug/ml detection antibody. Almost all the AuNPs are lighted up with detection antibody.
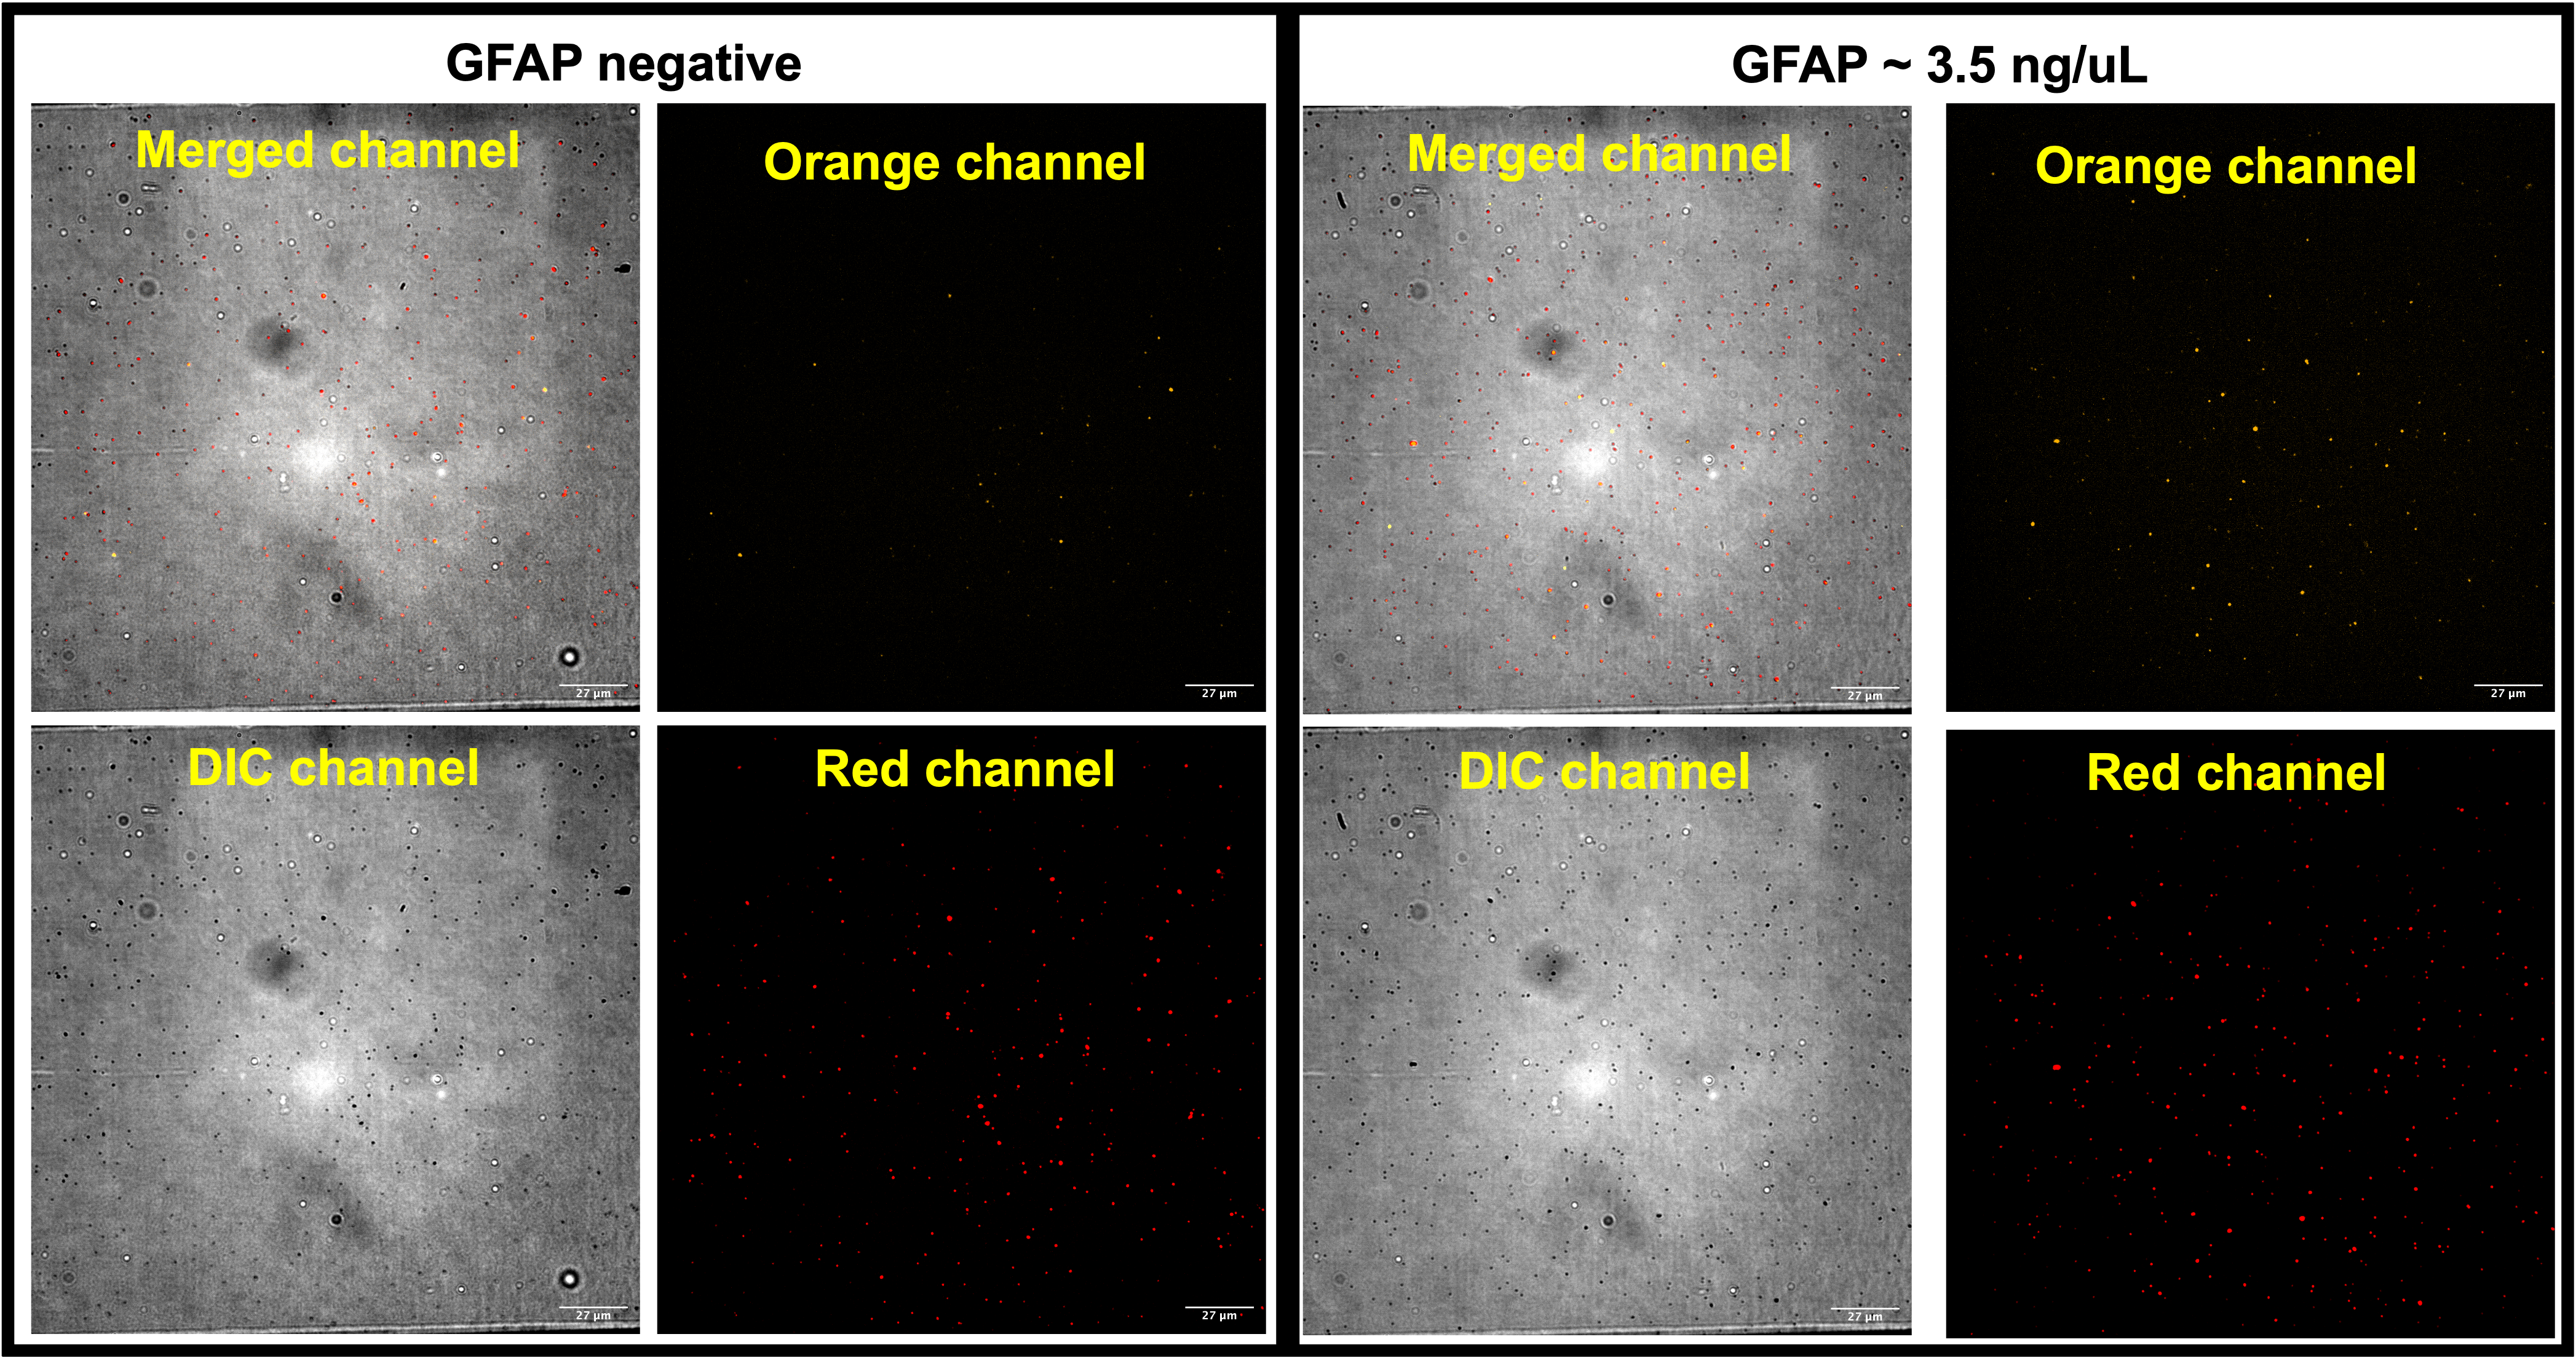
Fig. 3D. Trail 3) of CAD-IA based on protein G-modified AuNPs with PEG spacers: 10 ug/ml capture antibody & 2 ug/ml detection antibody. Almost all the AuNPs are lighted up with detection antibody.
Future directions
Though we haven’t come up with a final CAD-IA protocol with GFAP dose-dependency for clinical diagnostic applications, we have learned a lot from the previous trials. We should reduce non-specific binding of antibodies & antigens to particle surface by introducing PEGylation to the particles, prevent denaturing and aggregations of reagents by reducing freeze-thaw times and applying ultracentrifugations prior to usage, reduce false-positive by specific targeting, etc. Based on these experiences, we will try a fluorescent streptavidin-modified silica nanoparticles with PEG spacer as our next candidate for the final CAD-IA protocol.