μSiM Vasc-SkM update 2025.06.24
Since the last TraCe-bMPS update in April, we continued to explore different conditions to optimize the μSiM hVasc-SkM systems to obtain stable results.
Enhanced imaging for PDMS beams with Rhodamine staining
Previously we established a MATLAB program that detects the border of the PDMS beams and converts the movement of the PDMS beam from myobundle contraction to force. However, due to the need to wrap the myobundle around the PDMS beam to ensure myobundle attaches to the beams firmly, there is a layer of tissue around the beams, blocking the view. Depending on the thickness of the tissue, the quality of images can vary. Hence, we are trying to obtain a sharper border by staining with Rhodamine B. Among the concentrations tested, 0.1mg/mL Rhodamine B solution stained the PDMS enough to give good signal, while the solution is not too concentrated to be cleaned. After dopamine coating for improved myobundle attachment, UV sterilization, and subsequent culturing of myobundles on the hMoC, the Rhodamine-stained beams remained bright enough under red fluorescence channel. Under the fluorescence channel, we reduced the interference from the myobundle and obtained clearer border.
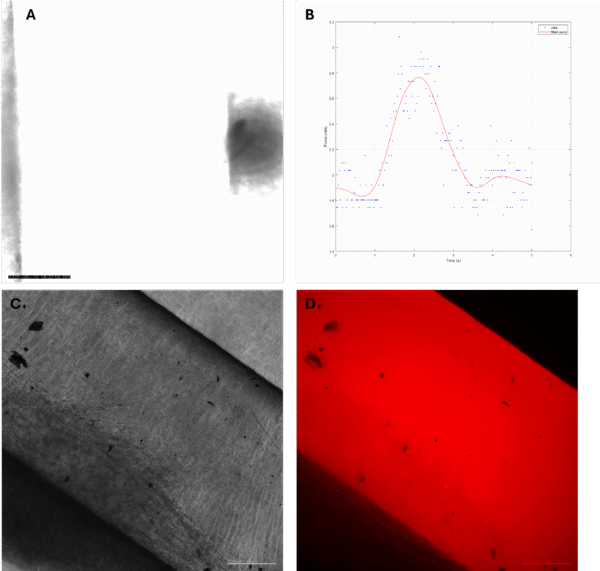
Fig1. (A) One frame from hMoC beam with myobundle phase contrast video under Etaluma microscope. (B) Corresponding force tracing of hMoC in A. (C) Phase contrast image of Rhodamine stained hMoC beam with myobundle. (D) hMoC in C under red channel of Etaluma microscope. Scale bars are 250 µm.
Meanwhile, ongoing experiments are testing the amount of Rhodamine B leached from stained PDMS at different concentrations over time and its toxicity on myobundles.
IFNβ treatment on myobundle force
We tested the influence of pretreatment of IFNβ on myobundle force. We treated the mature myobundles with different concentrations of IFNβ for 3 days and then continued to monitor the force for up to 3 days after the IFNβ is removed from the culture media. We did not observe significant reduction in the twitch and tetanus forces on most of the days in the treatment groups compared to the control. The percent fatigue was reduced in the treated group after IFNβ was removed from the media.

Fig 2. Mature myobundles were treated with different concentrations of IFNβ for 3 days and then changed to Differentiation media (control culture condition) from Day 14 to 17. Their twitch, tetanus, and percent fatigue was monitored. Mean ± SEM, N = 3-5, Two-way ANOVA.
Monocyte attachment in μSiM Vasc-SkM
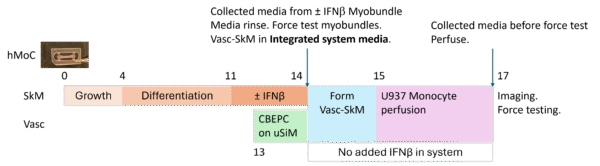
Fig 3. A general timeline for the μSiM Vasc-SkM experiments.
- Monocyte quantification for previous experiments
We quantified the monocyte attachment on the endothelium from the previous experiment using 5-µm dual scale porous membrane and observed a significant increase in monocyte attachment to the endothelium. The trend in monocyte attachment in the myobundles was not very stable. Also, we did not observe lower forces in the IFNβ treated hMoC, which led to the myobundle force tests in the section above. Hence, we are working on further improving the experiment timeline and conditions for more stable results.
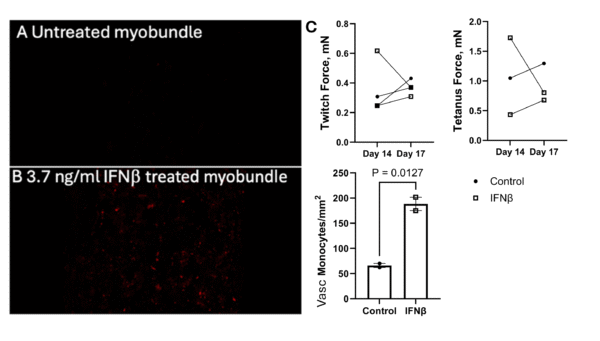
Fig 4. Fluorescence image of red monocytes on myobundles (A) untreated or (B) treated with 3.7ng/mL IFNβ. (C) hMoC twitch and tetanus force before and after the integration, and quantification of monocytes attached to the endothelium for μSiM Vasc-SkM with untreated Control myobundles and the IFNβ treated myobundles. Monocyte Mean ± SEM, N = 2.
- Reduced flow rate for lower shear stress did not seem to be advantageous compared to the initial 10 Dynes/cm2 flow.
We tried to reduce the flow rate to 1/4 of the original setup for a shear stress at 2.5 Dynes/cm2. However, we did not observe increased monocyte accumulation in the IFNβ pre-treated myobundles. The monocyte adhesion in the Vasc component was also largely reduced in both conditions.
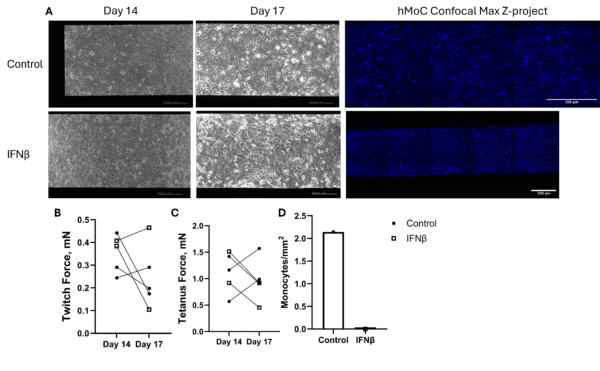
Fig5. (A) Phase contrast images for the endothelium on the Vasc component (Scale bars are 250um.) and the Max Z-project of confocal Z-stack images of the hMoC myobundles for nuclei (blue) and monocytes (red). (B) Twitch and (C) tetanus force changes of the hMoC before and after integration. (D) Quantification of monocytes on the endothelium in Vasc component. This experiment uses 3um dual scale porous membranes.
Based on the results from tracking the myobundle force after 3 days of IFNβ pre-treatment, we assessed whether maintaining the IFNβ in the hMoC channel would produce a more stable trend of monocyte adhesion and improve monocyte migration into the hMoC component. Hence, we added IFNβ to the media perfusing the back channel, where the hMoC resided. We also increased the IFNβ pre-treatment before integration from 3 days to 4 days. The flow rate tested in this experiment led to a shear stress of 5 dyne/cm2. However, we still did not observe an increase in monocyte accumulation in both hMoC and endothelium in IFNβ-treated groups.
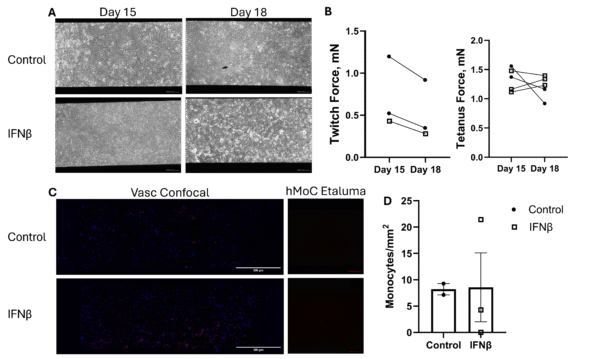
Fig6. (A) Phase contrast images for the endothelium on the Vasc component and the fluorescent images of the hMoC myobundles for monocytes (red, Scale bars are 250um.). (B) Twitch and (C) tetanus force changes of the hMoC before and after integration. (D) Quantification of monocytes on the endothelium in Vasc component. This experiment uses 3um dual scale porous membranes. Monocyte Mean ± SEM, N = 2-3.
However, another experiment with rheumatoid arthritis myobundles showed promising results. The myobundles were made of rheumatoid arthritis myoblasts and not treated with cytokines. The endothelial cells were seeded on the chip 2 days before integration instead of 1 day. And the integration was 4 days instead of 3 days, with the monocyte perfusion time unchanged. We observed monocyte adhesion to the endothelium in all chips (e.g. Fig. 7B) and monocyte transmigration and adhesion to the hMoC in most of the chips (e.g. Fig. 7C).
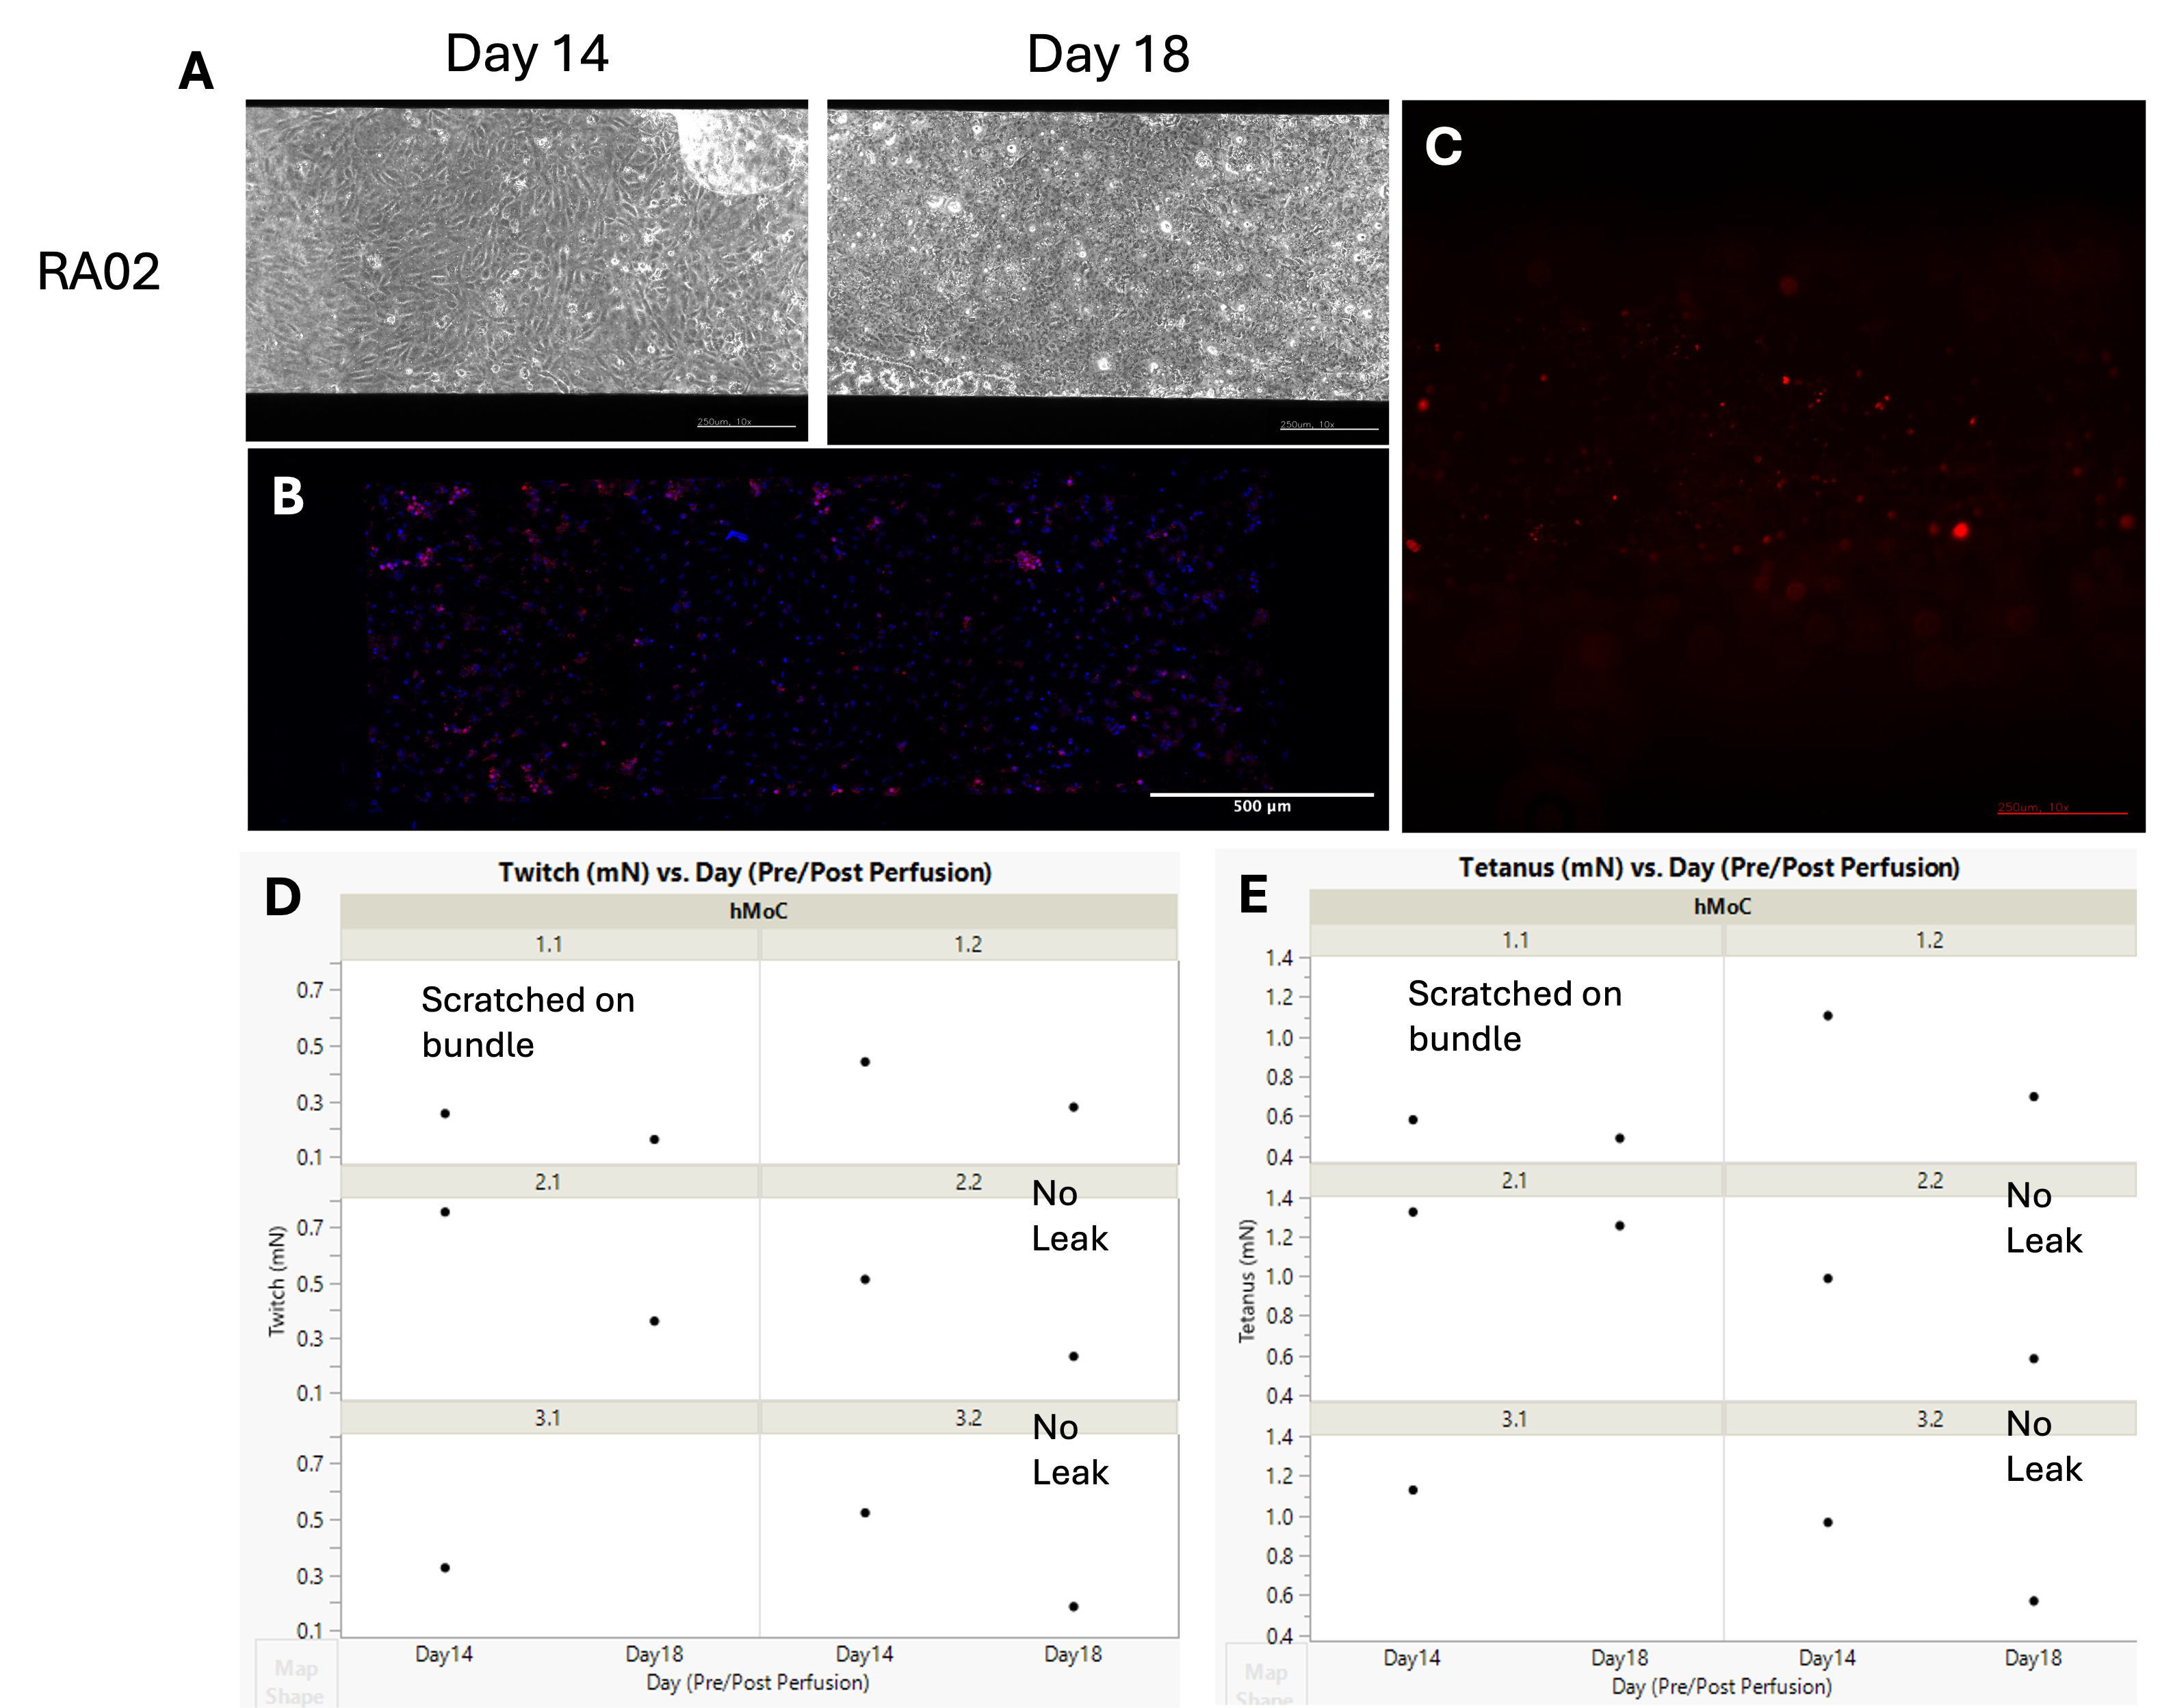
Fig 7. Monocyte attachment to endothelium and transmigration to rheumatoid arthritis (RA) myobundles. (A) Phase contrast images for the endothelium on the Vasc component. Scale bars are 250 µm. (B) Max Z-projection of the confocal fluorescent image for Vasc component for nuclei (blue) and monocytes (red); (C) Fluorescent images of the hMoC myobundles for monocytes (red). Scale bar is 250 µm; (D) Twitch and (E) tetanus forces of the hMoC before (day 14) and after (day 18) integration.
Currently, we are trouble shooting the monocyte adhesion on the endothelium and the hMoC. We plan to do an experiment resembling the conditions for the hToC monocyte transmigration experiments done by Isabelle. We plan to replace the tendon cells at the back channel with myotubes and use U937 monocytes. Hopefully this experiment can inform us of the cells and chips we should use.