The Yimei Method for Analyzing PDMS Beam Deflection in the μSiM Vasc-SkM
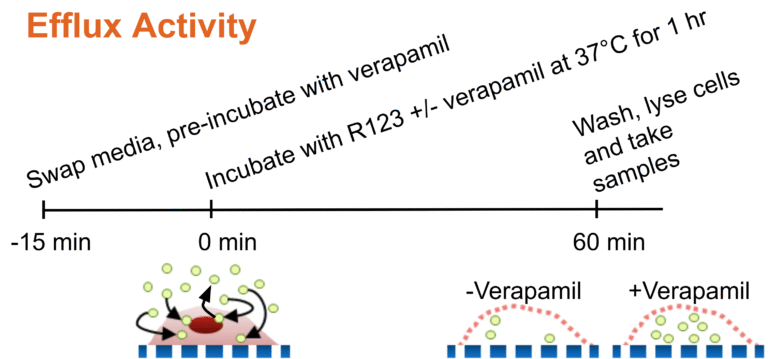
Image analysis for force from videos of deflected PDMS beams
In the summer, Yimei Du from University of Rochester visited Truskey lab to help with the μSiM Vasc-SkM system. Besides working with the chip culture, she helped improve the image analysis of the videos of PDMS beam deflection for more accurate myobundle force analysis.
We obtain the contractile force of the myobundles through analyzing the deflection of the PDMS beams from the video taken. Yimei further improved the analysis pipeline by processing the images with Gaussian filtering and Sobel filtering and then removed the noise from the dataset with more Gaussian filtering.
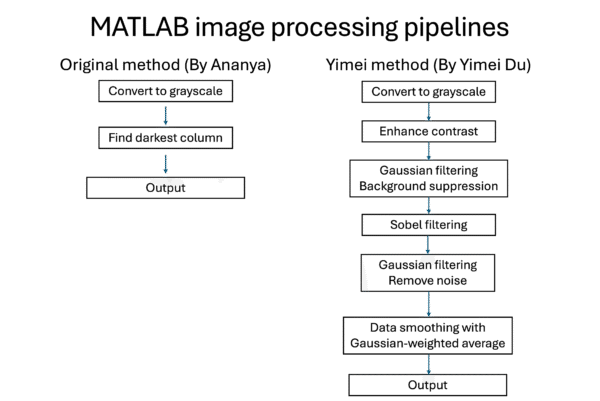
Figure 1. Block diagram for the original and new image processing pipelines developed by Ananya Sridhar and Yimei Du.
Below are a few examples of how the images of the beams being analyzed looks like and how the force tracing output from the two versions of the codes look like. The y-axis is aligned for each plot in the graph for easier comparison.
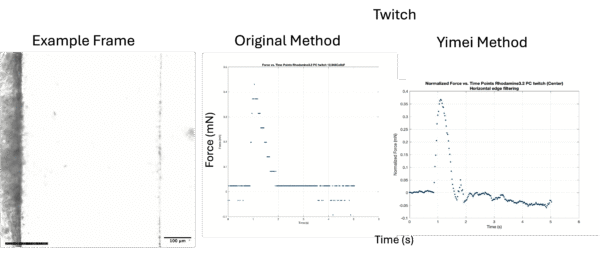
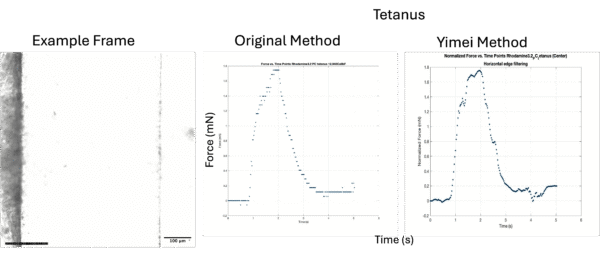
Figure 2. Example of a blur beam line and the Twitch and Tetanus force analysis outputs from the MATLAB code. ROI is taken at the right side of the beam.
In the version of analysis code created by Yimei, the selected region of interest undergoes a series of filters leading to the images shown in Figure 3. After these image processing procedures, the summed edge intensity from the left side to the right side of the ROI generates an intensity plot with a sharp peak indicating the location of the edge of the PDMS beam.
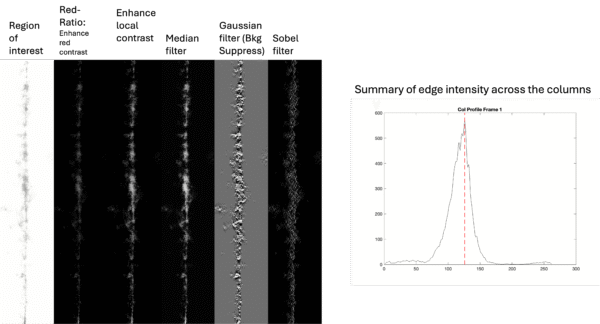
Figure 3. The region of interest from beam in Figure 2 and its appearance after each step of the image analysis pipeline in Yimei’s code (Left). The intensity of each column of the images from left to the right of the region of interest (Right).
Below is an example of analyzing a clearer beam (Figure 4, 5). The new version of code gave smoother force tracings curves and intensity plot.
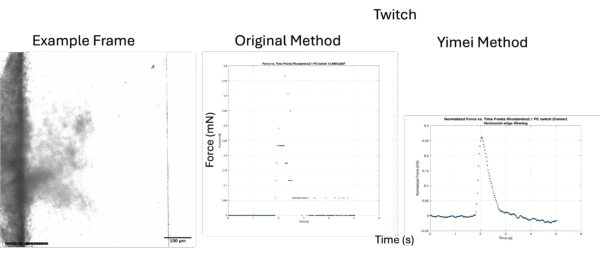
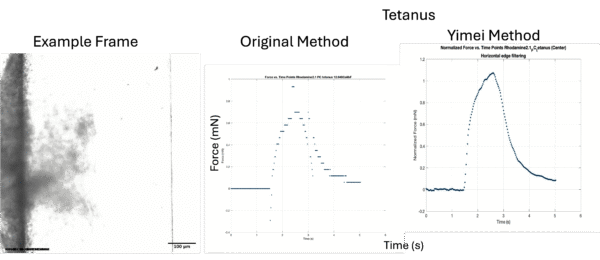
Figure 4. Example of a less blur beam line and the Twitch and Tetanus force analysis outputs from the MATLAB code.
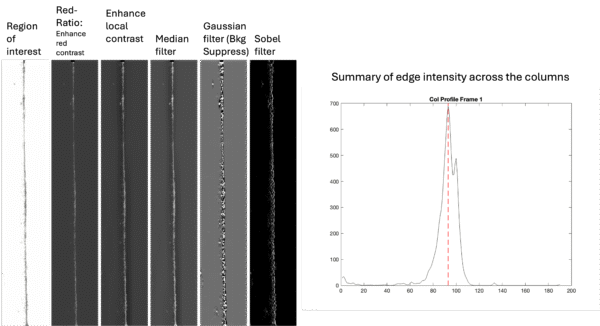
Figure 5. The region of interest from beam in Figure 4 and its appearance after each step of the image analysis pipeline in Yimei’s code (Left). The intensity of each column of the images from left to the right of the region of interest (Right).