Supplemental Permeability Figures
These are a couple of figures that may appear in the supplementary materials for the permeability paper.
The first tries to explain that most of our permeability is due to the largest pores. The lines plotted are the cumulative number of pores at each size (blue) and the cumulative permeability (green).
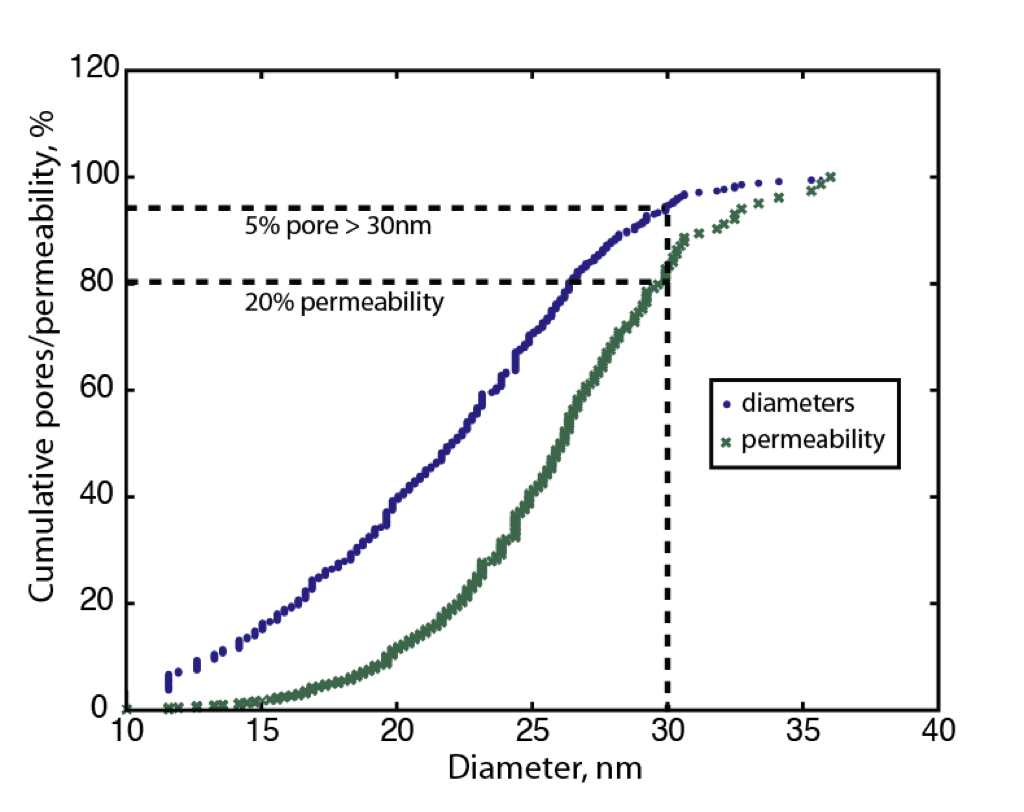
The lines show that only 5% of the pores are above 30nm, but they provide 20% of the total permeability. You can also see that 40% of the pores are 20nm or below, but they only give 10% of the total permeability. This shows that the big pores make up the majority of the permeability.
The next figure shows the permeability of a thin membrane with characteristics similar to the nanotube membranes that we cite. To do this I used the Tong/Dagan equation to find the permeability of a hypothetical thin membrane with the same porosity/pore sizes as the CNT membranes.
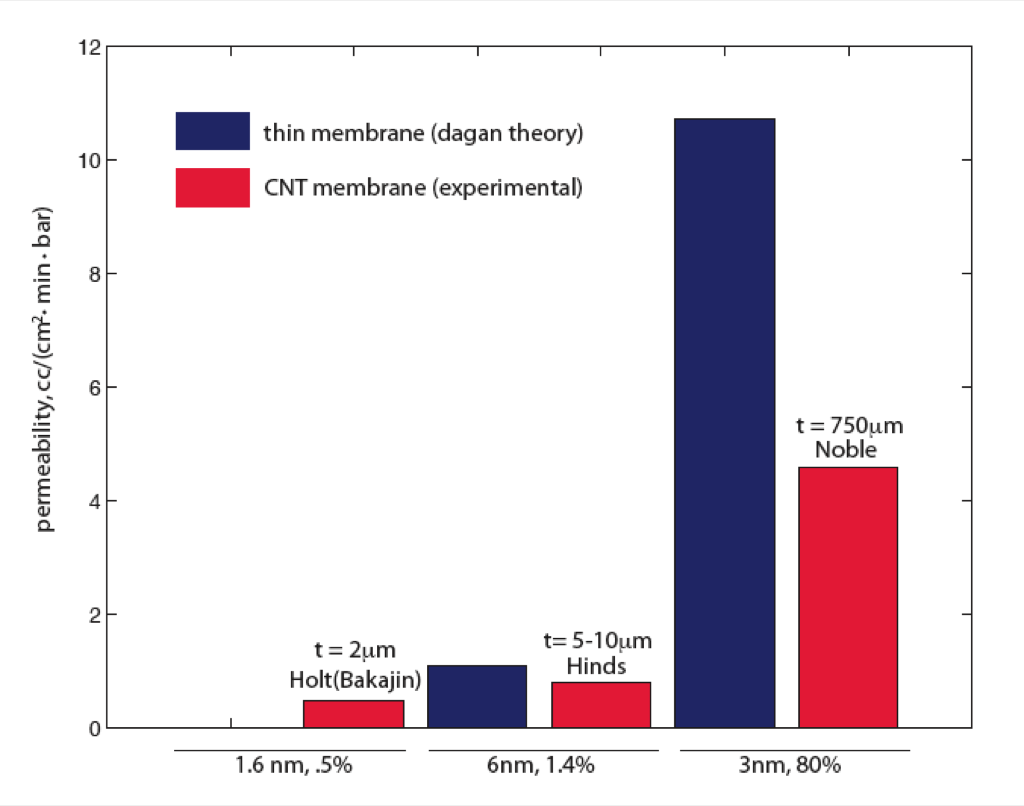
It appears that a thin membrane with 1.6nm and 5% porosity would have less permeability than the Holt(Bakajin) CNT membranes. In the case of the larger pore Hinds and Noble membranes, thin membranes with the same porosities and pore sizes would have greater theoretical flow.
These figures are for hydraulic permeability. Maryna – it would be good to go ahead and do something similar for gas. The effect of large pores is less pronounced but its still there.