Less is More: Lower Initial Bacteria OD Increases Transmission in uSiM-CA Bacteria Assays
On our quest to optimize bacteria assays using µSiM-CAs, we recently discovered that higher initial bacterial ODs decrease transmission in positive controls, described here. This was something we did not initially anticipate, engendering a new hypothesis around the idea that less initial bacteria leads to more transmission across our membranes in the µSiM-CAs due to a lower likelihood of biofilm formation. To test this hypothesis, we completed bacteria assays while following similar standardized protocols to those which we previously developed but with a lower initial optical density (OD) than before. Our approach and results are shown below.
Finding a New OD
The first thing we set out to do was find a new OD to use in our bacteria assays. Previously, we used bacteria in a range of 0.2-0.4 OD which created a situation where at the start of every assay, there were more bacteria than pores. This only became worse over time as bacteria divided and was something that we thought could be attributed to our poor transmission, presumably due to the formation of biofilms. Steve Gill set out to avoid this by creating a growth curve from which we could attribute OD measurements to total number of bacteria. He did this with the following protocol.
Protocol
- Inoculated 250 ul of a USA300 glycerol stock into 50 ml of Tryptic Spy Broth (TSB) in a 500 ml flask
- Incubated at 37°C
- Read the OD immediately after inoculation and then collected aliquots every 30 minutes from the flask for OD measurement
- After collecting ODs, completed a dilution series to determine Colony Forming Units(CFU)/ml for each aliquot by plating and growing each on agar plates
Results
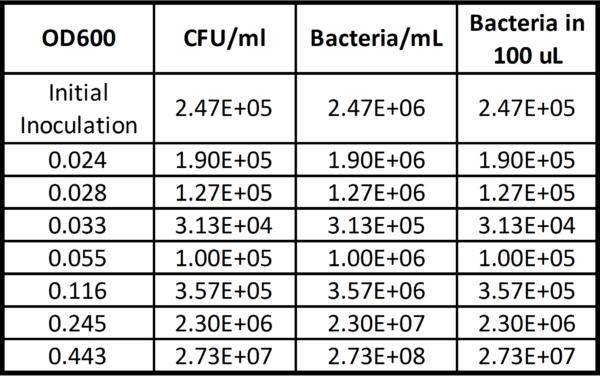
OD readings were unstable at lower concentrations because they were near the limit of detection of the spectrophotometer that was being used. Despite this, we were able to count the number of CFUs for the initial inoculation and each following aliquot and combine these values with their respective OD measurements. This data is shown in Figure 1 below, translated into bacteria/mL based off of the assumption that every CFU contains 10 bacteria (derived from the results of this paper) and then total bacteria in 100 µL (essentially bringing us back to our initial CFU/mL value).
With this data, we were also able to make a predictive plot shown in Figure 2 below.

Acknowledging that this data is only accurate with the Beckman spectrophotometer in the Gill lab, we decided to use an an initial OD of 0.1 in our next round of experiments. As is shown in Figure 1, this equates to ~3E5 bacteria/mL which is less than the number of pores in one of our 0.5 µm microporous membranes (~3E6).
Testing Transmission Using 0.1 OD
For this experiment we followed a similar protocol to the one described here. The biggest changes in our protocol pertained to how we prepared our bacteria. To reproducibly get the same concentration of bacteria every experiment, we decided to stop making overnight cultures and instead grew our bacteria from an exact starting stock volume. We also did not use a pulldown this time around. These changes are reflected below in red.
Preparing the µSiM-CAs for Testing and Loading them with Bacteria
*Protocol changes shown in red
- Ahead of time, prepare Tryptic Soy Broth (TSB) by adding 30 g of BBL Trypticase Soy Broth to 1 L of purified water
- Mix thoroughly and warm gently until powder is completely dissolved
- Autoclave at 121°C for 15 minutes
Start an overnight culture by scraping up a chunk of glycerol stock with a pipette tip and adding it to 2 mL of TSBTake this overnight culture and put it into a shaker, shaking at 37°C overnightThe next day, create a subculture by adding 1 mL of your overnight culture to 100 mL of TSB- Add 250 µl of USA300 glycerol stock into 50 ml of TSB (in a 500 ml flask)
- Add 50 uL Chloramphenicol (CLM) antibiotic to the same flask
- Put the culture in a shaker and let grow at 37°C while shaking until it measures an OD of ~0.1
- While the culture is growing, thoroughly examine each µSiM-CA device you will use for any defects such as improper sealing between components or broken membranes
- Prepare petri dishes to hold µSiM-CA devices by placing 2 Kim Wipes moistened with sterile dH2O along the perimeter of each petri dish
- Pipette ~15 µL of TSB media by inserting the pipette tip into one of the two open ports of the µSiM-CA and depressing the plunger of the pipette; the media should flow from this port through the bottom channel and out the opposite, open port. Remove the pipette tip before releasing the plunger of the pipette to avoid sucking injected fluid back out of the bottom channel of the device
- With the bottom channel wet, block one of the open ports using a 3M double-sided tape sticker and stabilize the devices with clamps around its sides
- Fill the well of the µSiM-CA by pipetting 100 µL of fresh TSB into it; care is taken to not create air bubbles and/or remove them by by withdrawing injected media and injecting it again until no air bubbles are visible
- In the same manner as above, pipette ~40 µL of TSB media into the open port and look to see the well fill with little resistance. If resistance is appreciable, discard the device and prepare a new one
- Remove all liquid from the well (~140 µL), then add 15 µL of TSB into the open port
- Next, add 100 µL of the desired OD subculture to the well of each device, withdrawing and injecting the subculture again if air bubbles are present until they are gone
- Allow all devices to incubate at 37°C for 6 hours
After loading, I imaged the devices at different time points up to 6 hours using confocal imaging and the method described below.
Confocal Imaging µSIM-CA Devices Containing GFP Tagged Staphylococcus aureus
- PDMS blocks (~5 mm thick) were laid on top of loaded µSiM-CA devices in order to allow them to be imaged in the microscopy core while maintaining gas permeance
- Any liquid pushed out to the sides of the device is wiped away with a Kim Wipe
- To create an adequate seal, the interface between the PDMS bottom and the acrylic top of the device was sealed with nail polish
- Upon sealing, devices were stored in petri dishes filled with wet Kim Wipes for transport over to river campus
- Once at the microscopy core, images were taken with the 60X water immersion objective and the 1.5X magnifier on the base of the confocal microscope. The 488 nm laser was used with the 525 nm filter
- While imaging, devices were stored in an incubator stage attached the confocal microscope which is held at 37°C
- In between imaging sessions, devices were stored in an oven held at 37°C containing two 1 L beakers of DI water
Results
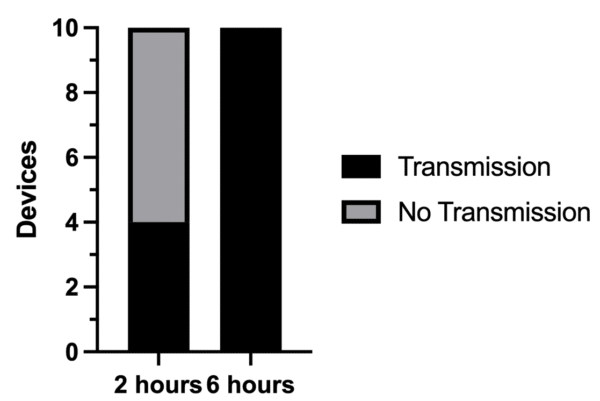
Transmission through the devices was great, with 4 devices having bacteria in their bottom channels after 2 hours and all 10 devices having bacteria in their bottom channels at the end of our assay after 6 hours. This is shown in Figure 3 below.
Notably, a lot less bacteria was in the bottom channel of the devices after our assay was over than when we used a higher initial OD. This can be seen in Figure 4 below which shows images of the membrane and bottom channel in every device after 2 hours and 6 hours. This is somewhat expected since we started with less bacteria in the first place.
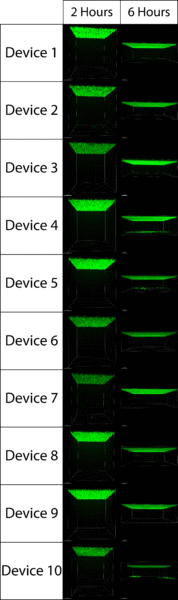
I took the 6 hour images with a 20X objective thinking the lower magnification would give me a better representation of bacterial transmission across a larger area of the bottom channel in one image. While this was the case, it also made finding bacteria very challenging, especially when there were only a handful of bacteria in the bottom channel of some of the devices. As a result, I will avoid using the 20X objective in the future.
Conclusions and Future Directions
After making a growth curve with our Staphylococcus aureus, we were able to find an OD which provided us with less initial bacteria than pores on our membrane. Using this initial OD in our assay gave us 100% transmission! We will try to replicate this success with the Gill lab and the Dunman lab next. In parallel we will also test a pulldown with this low OD.