A Serendipitous Disaster of Interesting Proportions: High OD Staphylococcus aureus Pulldown on 0.5 µm Microporous Membranes
After titrating our pulldown volume to avoid pulling Staphylococcus aureus through our membranes, discussed here, we found that 10 µL withdrawals allow us to continue to use the pulldown modification without compromising our results by providing false positive transmissions. With newfound confidence in this pulldown modification, we took a step backwards to repeat a bacterial transmission assay using the pulldown modification to see if we could repeat the success that we previously had with the 50 µL withdrawal which pulled bacteria through the membrane. On account of serendipity, our results were not what we expected but shed some light on the mystery plaguing our assay performance up until this point.
Protocol
For this experiment we followed a similar protocol to the one described here. The only changes we made account for the smaller withdrawal volume that we used this time around.
Preparing the µSiM-CAs for Testing and Loading them with Bacteria
*Protocol changes shown in red
- Ahead of time, prepare Tryptic Soy Broth (TSB) by adding 30 g of BBL Trypticase Soy Broth to 1 L of purified water
- Mix thoroughly and warm gently until powder is completely dissolved
- Autoclave at 121°C for 15 minutes
- Start an overnight culture by scraping up a chunk of glycerol stock with a pipette tip and adding it to 2 mL of TSB
- Take this overnight culture and put it into a shaker, shaking at 37°C overnight
- The next day, create a subculture by adding 1 mL of your overnight culture to 100 mL of TSB
- Put the subculture in a shaker and let grow at 37°C while shaking until it measures an OD between 0.2-0.4
- While the subculture is growing, thoroughly examine each µSiM-CA device you will use for any defects such as improper sealing between components or broken membranes
- Prepare petri dishes to hold µSiM-CA devices by placing 2 Kim Wipes moistened with sterile dH2O along the perimeter of each petri dish
- Separate and label µSiM-CA devices into two groups: the first used for withdrawing the bacteria onto and potentially through the membrane and the second to display any bacteria that is pulled through the first group of devices
- Pair the devices so one device from each group corresponds to another in the second group
- Pipette ~15 µL of TSB media by inserting the pipette tip into one of the two open ports of the µSiM-CA and depressing the plunger of the pipette; the media should flow from this port through the bottom channel and out the opposite, open port. Remove the pipette tip before releasing the plunger of the pipette to avoid sucking injected fluid back out of the bottom channel of the device
- Fill the well of the µSiM-CA by pipetting 100 µL of fresh TSB into it; care is taken to not create air bubbles and/or remove them by by withdrawing injected media and injecting it again until no air bubbles are visible
- With the bottom channel and well wet, block one of the open ports using a 3M double-sided tape sticker and stabilize the devices with clamps around its sides
- In the same manner as above, pipette ~40 µL of TSB media into the open port and look to see the well fill with little resistance. If resistance is appreciable, discard the device and prepare a new one
- Remove all liquid from the well (~140 µL), then add 15 µL of TSB into the open port
- Add 75 µL of TSB media to the wells of all of the devices in group 2 so that their total well volume is 90 µL
- Next, add 100 µL of the desired OD subculture to the well of each device in group 1 (the devices used for withdrawal), withdrawing and injecting the subculture again if air bubbles are present until they are gone
- Withdraw 10 µL of fluid from the open port of the devices in group 1, sucking fluid from the well through the membrane, into the bottom channel and out the port
- Immediately take the withdrawn media from the group 1 device and inject this into the well of the corresponding device in group 2
Replenish the well volume of group 1 devices to 100 µL by pipetting 35 µL of TSB directly into the well- Allow the all devices to incubate at 37°C for 6 hours
After loading, I imaged the group 1 devices at different time points up to 6 hours using confocal imaging and the method described below. Using the same method below, I also imaged the group 2 devices after 6 hours of incubating in order to allow any bacteria that may have been pulled through the membrane the chance to divide substantially, increasing our odds of seeing them even if only a handful of bacteria is pulled through.
Confocal Imaging µSIM-CA Devices Containing GFP Tagged Staphylococcus aureus
- PDMS blocks (~5 mm thick) were laid on top of loaded µSiM-CA devices in order to allow them to be imaged in the microscopy core while maintaining gas permeance
- Any liquid pushed out to the sides of the device is wiped away with a Kim Wipe
- To create an adequate seal, the interface between the PDMS bottom and the acrylic top of the device was sealed with nail polish
- Upon sealing, devices were stored in petri dishes filled with wet Kim Wipes for transport over to river campus
- Once at the microscopy core, images were taken with the 60X water immersion objective and the 1.5X magnifier on the base of the confocal microscope. The 488 nm laser was used with the 525 nm filter
- While imaging, devices were stored in an incubator stage attached the confocal microscope which is held at 37°C
- In between imaging sessions, devices were stored in an oven held at 37°C containing two 1 L beakers of DI water
Results
Everything started per usual with this experiment, but about halfway through a fire alarm went off which caused my culture to over grow significantly. As a result, instead of loading the bacteria into the well at an OD around 0.2, I loaded the bacteria in at an OD of 0.37. Shown in Figure 1 below, this gave us awful results.
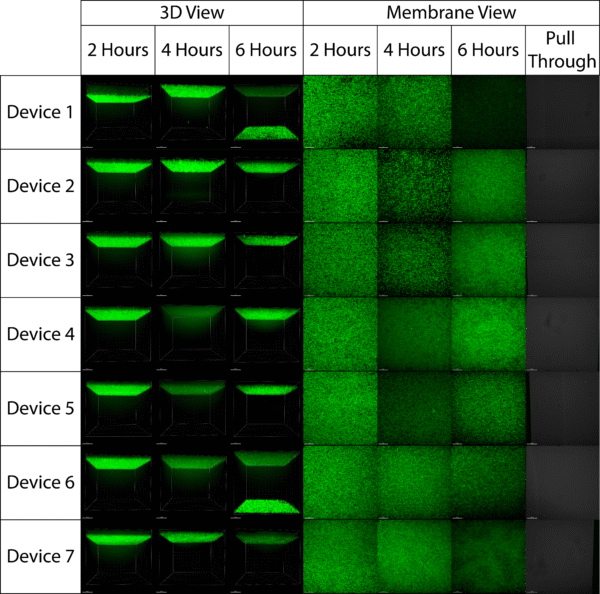
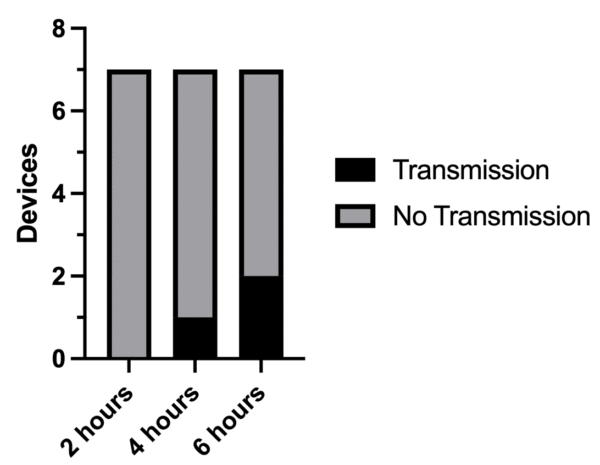
Transmission was much lower than usual using the higher OD. Shown in Figure 1 and summarized in Figure 2 below, no devices had transmission after 2 hours, one device had transmission after 4 hours, and only two devices had transmission after six hours. This gave us an overall transmission of only 29%, down from our typical 75% transmission. The silver lining to these results is that we again did not pull any bacteria through the membrane with our 10 µL withdrawal.
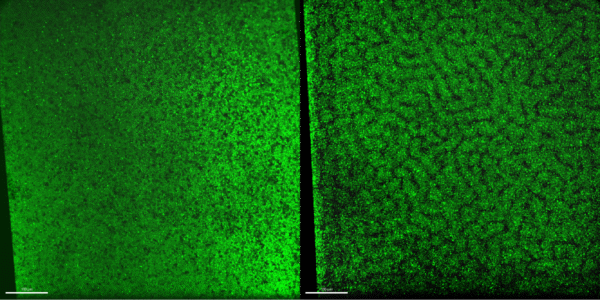
Interestingly, most of the membranes that did not have transmission had evidence of biofilm formation seen as bacterial clumping on and above the membrane. This was also seen on top of two pull through membranes which we had loaded with bacteria that we had pulled through two group 1 devices that had broken membranes. These images, shown in Figure 3 below, were taken at a lower magnification (20X) and show evidence of advanced biofilm formation.
Conclusions and Future Directions
Overall, we were surprised by how bad our assay performance was but we were also encouraged by the fact that it seemed there was an obvious culprit for our issues in biofilm formation. Our results left us unable to comment on the utility of a 10 µL pulldown, but it did signal to us a need to decrease the OD of the bacteria that we add to our devices in the future. As a result, we decided our next move should be to retry this experiment but at a lower OD.