NanoParticle Tracking Analysis Measurement for Media
Hello Everyone,
So Now that we have NanoSight in our lab, i decided to run some experiments with different conditions of media and compare the number of particles in each media. We designed this set of experiments like:
- Water
- DMEM
- DMEM + Exosome Free FBS
- DMEM + FBS
- ADSC Conditioned Media
- HDFB Conditioned Media
- HUVEC Conditioned Media
So when you run your experiment with NanoSight, you’ll get a file like figure 1, and the concentration mentioned in the file is the surface area below the graph.
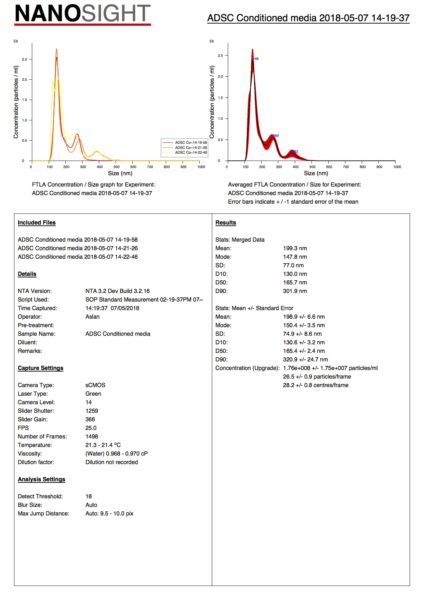
Figure 1; Generated PDF file by NanoSight
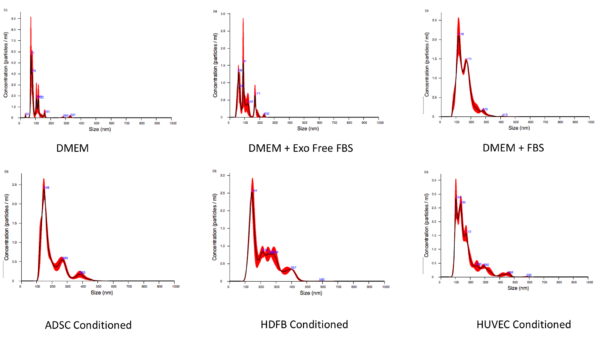
Figure 2; All Conditions Graphs.
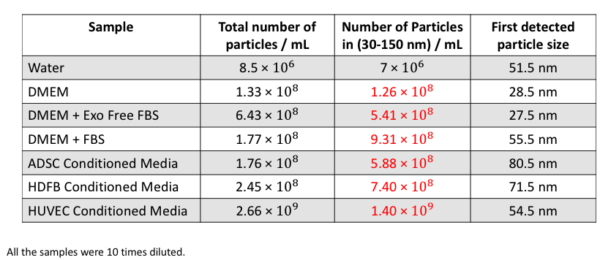
So using the excel file which gives you more detailed information, i decided to sum up the concentration of particles that are in the size range of 30 – 150 nm (Exosome size range particles not necessarily exosomes).
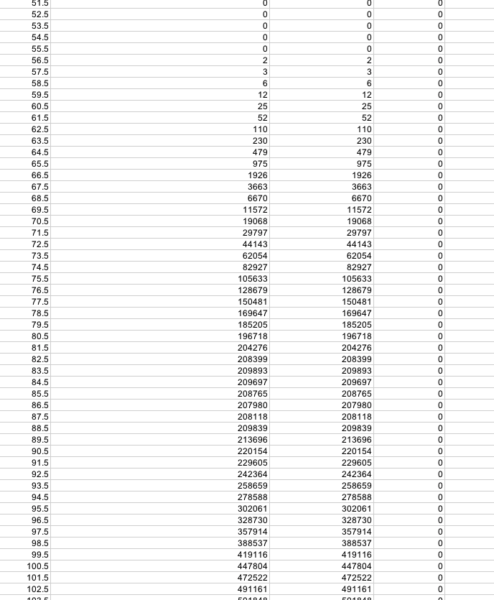
You can see the concentration of 30 – 150 nm particles in each of the samples in the Table 1.