TEER measurement data and a video of concurrent measurement and microscopy
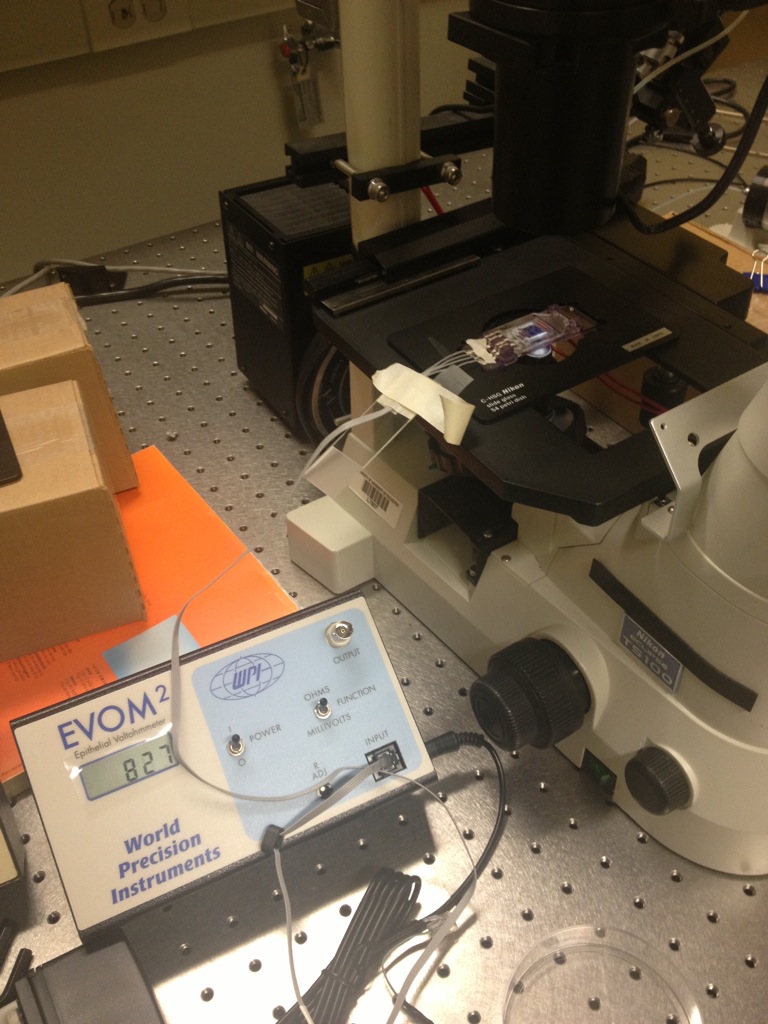
Although the connection of those electrical circuits was always unstable, Greg and I did get some TEER measurement with this set up:
|
Device A |
Day 1 |
Day 2 |
Day 3 |
Day 4 |
Day 5 |
|
EVOM 1 |
-3450Ω* |
-1000Ω |
-1200 Ω |
-1000 Ω |
/ |
|
EVOM2 |
100 Ω |
-9600 Ω |
450 Ω |
-3 Ω |
827Ω |
|
Device B |
Day 1 |
Day 2 |
Day 3 |
Day 4 |
Day 5 |
|
EVOM 1 |
-7250 Ω |
2380 Ω |
-300 Ω |
Cell Dead |
/ |
|
EVOM2 |
190 Ω |
11891 Ω** |
400-900 Ω (not stable) |
Cell Dead |
/ |
*Negative value indicates electrical contamination/short.
** This data is larger than the confidence interval of EVOM2.
Dealing with this device really requires skills, and this device needs some improvements.
First of all, it was difficult to use media to make contact with top and bottom ITOs without letting the media contact with the silver lines (which may cause a short). This problem will be solved if that company could draw and coat the silver circuits for us.
Also, the UV-Ozone bonding was not very effective in preventing leaking. Leaked media went underneath the bottom gasket and caused the media in the wells dry out much faster. Basically I have to add new media twice a day to keep the cells alive. I was wondering if the cytovu could be modified to a close-environment device, which could absolutely prevent evaporation.
Another thing I could think about is about the electric connection. As the data shows, we seldom get good date point and sometimes when we push a little bit on the lid, the data changed, either became more stable or changed its positive/negative sign. Negative data means electrical contamination. So this indicates that the connection is less- than-ideal.
Although we are skeptical of these data, we did calculate TEER from some of the data that we most believed in.
TEER = (Measured – background) * Area
For Device A – Day3, TEER = ( 450 – 100) *0.04 = 14 Ω▪cm2c
For Device A – Day5, TEER = ( 827 – 100) *0.04 = 29 Ω▪cm2c
So actually we could say that there is an increase in TEER as the cell grown to confluence.
We were concerned that the TEER measurement was harmful to the cells because on Wednesday the cells looked dead after TEER measurement, but then recovered after 4 hrs incubating. Here is a comparison of the cells before and after TEER measurement.

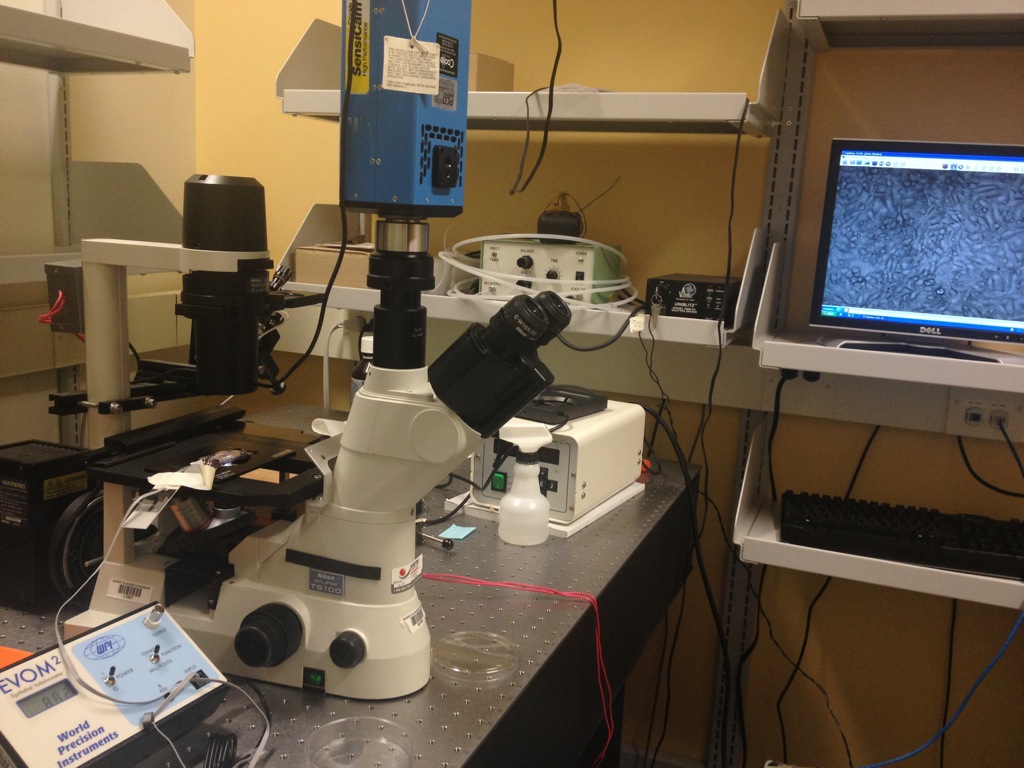
I also took a video of the concurrent TEER measurement with microscope today. It seems that the change of cells is a little more obvious. From this video we can see some of the cells are turning themselves to round shape. So there might be some electrical influence to the cells and cause them to ball up.
TEER Test 40min bottom left-faster
At some point, we should just leave the cells out in the measurement environment and observe if similar retraction behavior occurs, with no TEER recording. The behavior may be due to non-ideal temperature and gas exchange for the cells.
Yeah that’s true. We should set a control group.