The Feasibility of Using Flow Cytometry to Quantify Cellular Markers in hToC Collagen Gels
Introduction
Over the past few months, I have been characterizing and comparing iPSC-derived monocytes (iMonocytes) with peripheral blood-derived (PB) monocytes. As I wrap up these experiments, we’ve decided to look at marker expression on iMonocytes and PB monocytes once they have been polarized to macrophages by culturing the iMonocytes or PB monocytes with HTEN051 fibroblasts in the hToC collagen I gels. We had initially thought of labeling the iMacrophages with one marker for M1 (pro-inflammatory) macrophages and one marker for M2 (anti-inflammatory macrophages) and imaging on the confocal microscope. However, a limitation of using imaging to look at marker expression is that we can only look at 4 markers. In this case, the four markers we would look at are actin (fibroblast marker), Hoechst (nuclear stain), CD86 (M1 macrophage marker), and CD206 (M2 macrophage marker). This limits us to only looking at one marker each to characterize M1 and M2 macrophages. We therefore considered using flow cytometry to characterize the iMacrophages so that we could look at expression of a variety of M1 and M2 macrophage markers.
In the past, one difficulty of using flow cytometry was recovering enough macrophages to do analysis on from the hToCs. To resolve this issue, we increased the number of macrophages seeded in the gels based on previous literature discussing tendon healing. We also ran a pilot experiment to determine if we could digest a sufficient number of macrophages from the hToC gels to do this analysis. Theoretically, each gel contained 50,000 fibroblasts and 25,000 macrophages. We wanted to record at least 10,000 events per sample and ideally closer to 20,000 events if possible. We also wanted to avoid pooling the hToCs together into one sample as that would cause us to need a lot more hToCs per experiment. The objective of this experiment was to determine if an adequate number of cells, particularly macrophages, could be digested out of hToC gels after six days of culture to record at least 10,000 events on the flow cytometer.
Methods
Setting up hToC devices
PB monocytes were isolated from whole blood from healthy donors using the SepMate PBMC isolation tubes from StemCell Tech and CD14 magnetic microbeads. iMonocytes were thawed from cryopreservation into RPMI media +10% FBS and 0.5% P/S. HTEN051 fibroblasts were used from a confluent T175 flask. Fibroblasts were suspended in collagen I hydrogels at 500,000 cells/ml and either PB monocytes or iMonocytes were added to the suspension at a ratio of 2:1 fibroblasts to monocytes. The seeding density of fibroblasts was determined based on previous hToC protocols1, 2. The ratio of 2:1 fibroblasts to monocytes was determined based on tendon healing studies in an in vitro model and in vivo mouse model3, 4. Once fibroblasts and either PB monocytes or iMonocytes were combined in the collagen I gel, 100 µl of the gel suspension was added to the hToC channels with 200 µl of X-VIVO media + 20 ng/ml macrophage colony stimulating factor (M-CSF). M-CSF was added to polarize monocytes into M0 macrophages. Devices were cultured for 6 days (Day-6 – Day 0) according to previous protocols2 and on Day 0, devices were digested out of gels for flow cytometry. The workflow is shown in Figure 1.
 Figure 1. hToC flow cytometry workflow. Created in BioRender.
Digestion and staining for flow cytometry
To digest fibroblasts and macrophages out of the gels, gels were submerged in 1 mg/ml collagenase I and 2 mg/ml dispase for 45-60 minutes at 37 °C to release cells. Midway through the incubation, cells were pipetted up and down and vortexed to allow for mechanical digestion. After incubation, cells were pipetted up and down once more and passed through a 70 µm strainer to ensure a single cell suspension. Filters were then washed with X-VIVO media and cells were pelleted to remove collagen. Cells were then resuspended in 80 µl FACS buffer and 20 µl FcR blocking reagent per sample. Cells were incubated with blocking reagent for 10 minutes on ice and after incubation, antibodies were added to each sample based on the manufacturer’s recommendation (Table 1).
Table 1. Recommended antibody volume added per sample.
| Antibody | CD45 APC-CF750 | CD90 RealBlue 705 |
| Volume (µl) in 100 µl staining volume | 3 µl/million cells | 5 µl/million cells |
Staining for CD45 (immune cell marker), CD90 (fibroblast marker), and propidium iodide (live/dead stain) were done. Samples were incubated for 30 minutes on ice with antibodies and PI was added at 10 µg/ml approximately 10 minutes before going to the flow cytometer. All single stained and fluorescence minus one controls were made using PB macrophage hToC samples. Analysis was done in FCS Express 7.
Results
We were able to record between 10,000 and 20,000 events from one hToC with PB macrophages or iMacrophages. Cells were gated for size and complexity based on forward and side scatter respectively as well as for single cells based on forward scatter area and forward scatter height (Figure 2).
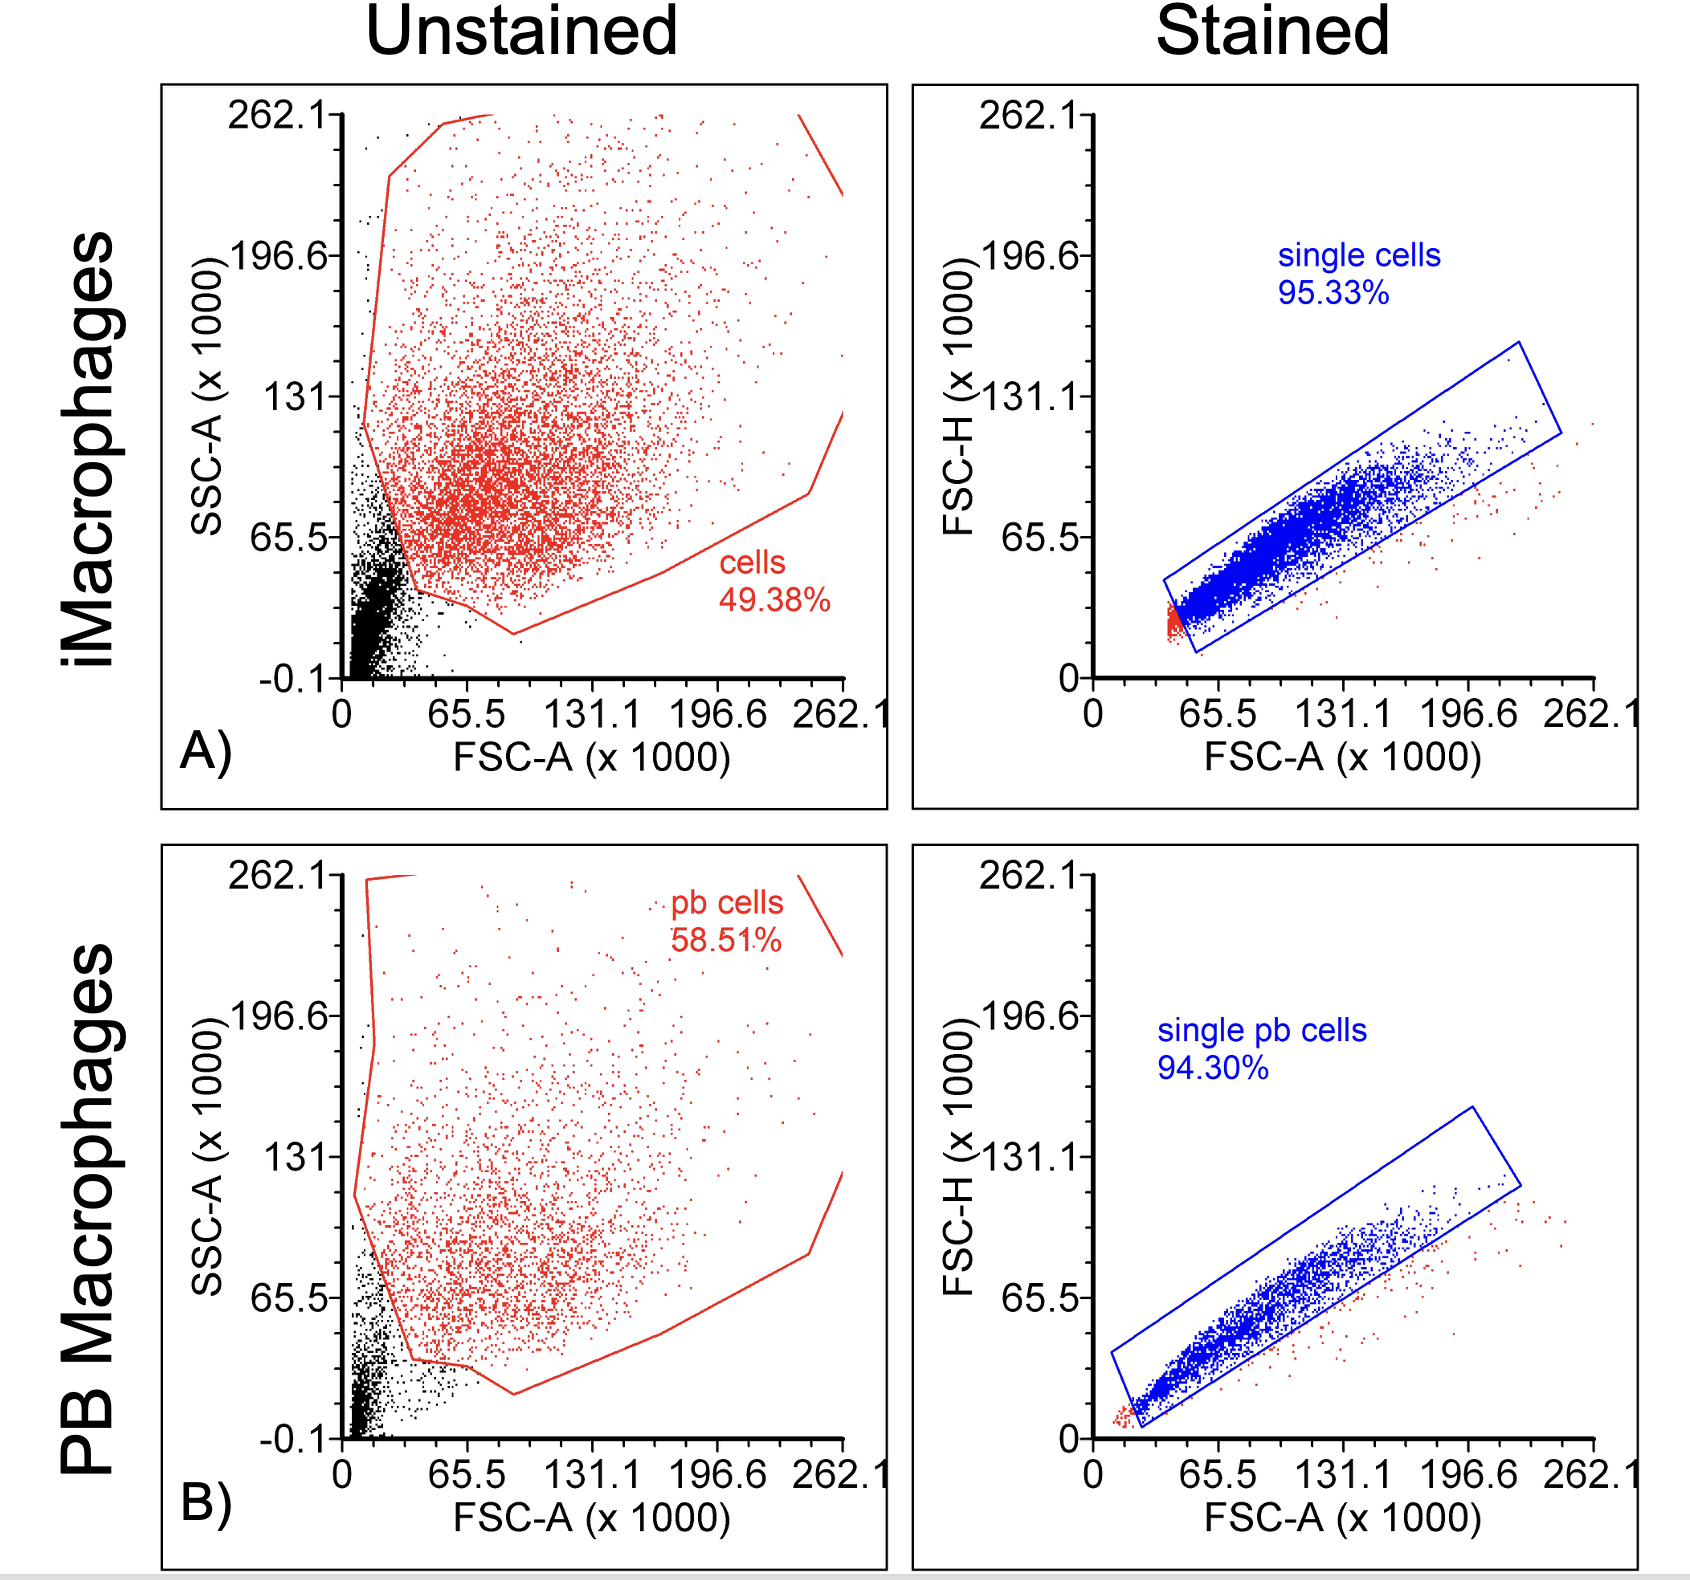
Of the total recorded events, 49.38% were identified as cells for iMacrophages and 58.51% were identified as cells for PB macrophages (Figure 2A and 2C). Events shown in the bottom left corners of Figures 2A and 2C are likely debris due to their small sizes. For both iMacrophages and PB macrophages, single cells were identified as over 94% for both populations, indicating that there were few doublets. Additionally, gating for live cells was done by selecting the negative population since the live/dead stain was propidium iodide which labels dead cells (Figure 3).
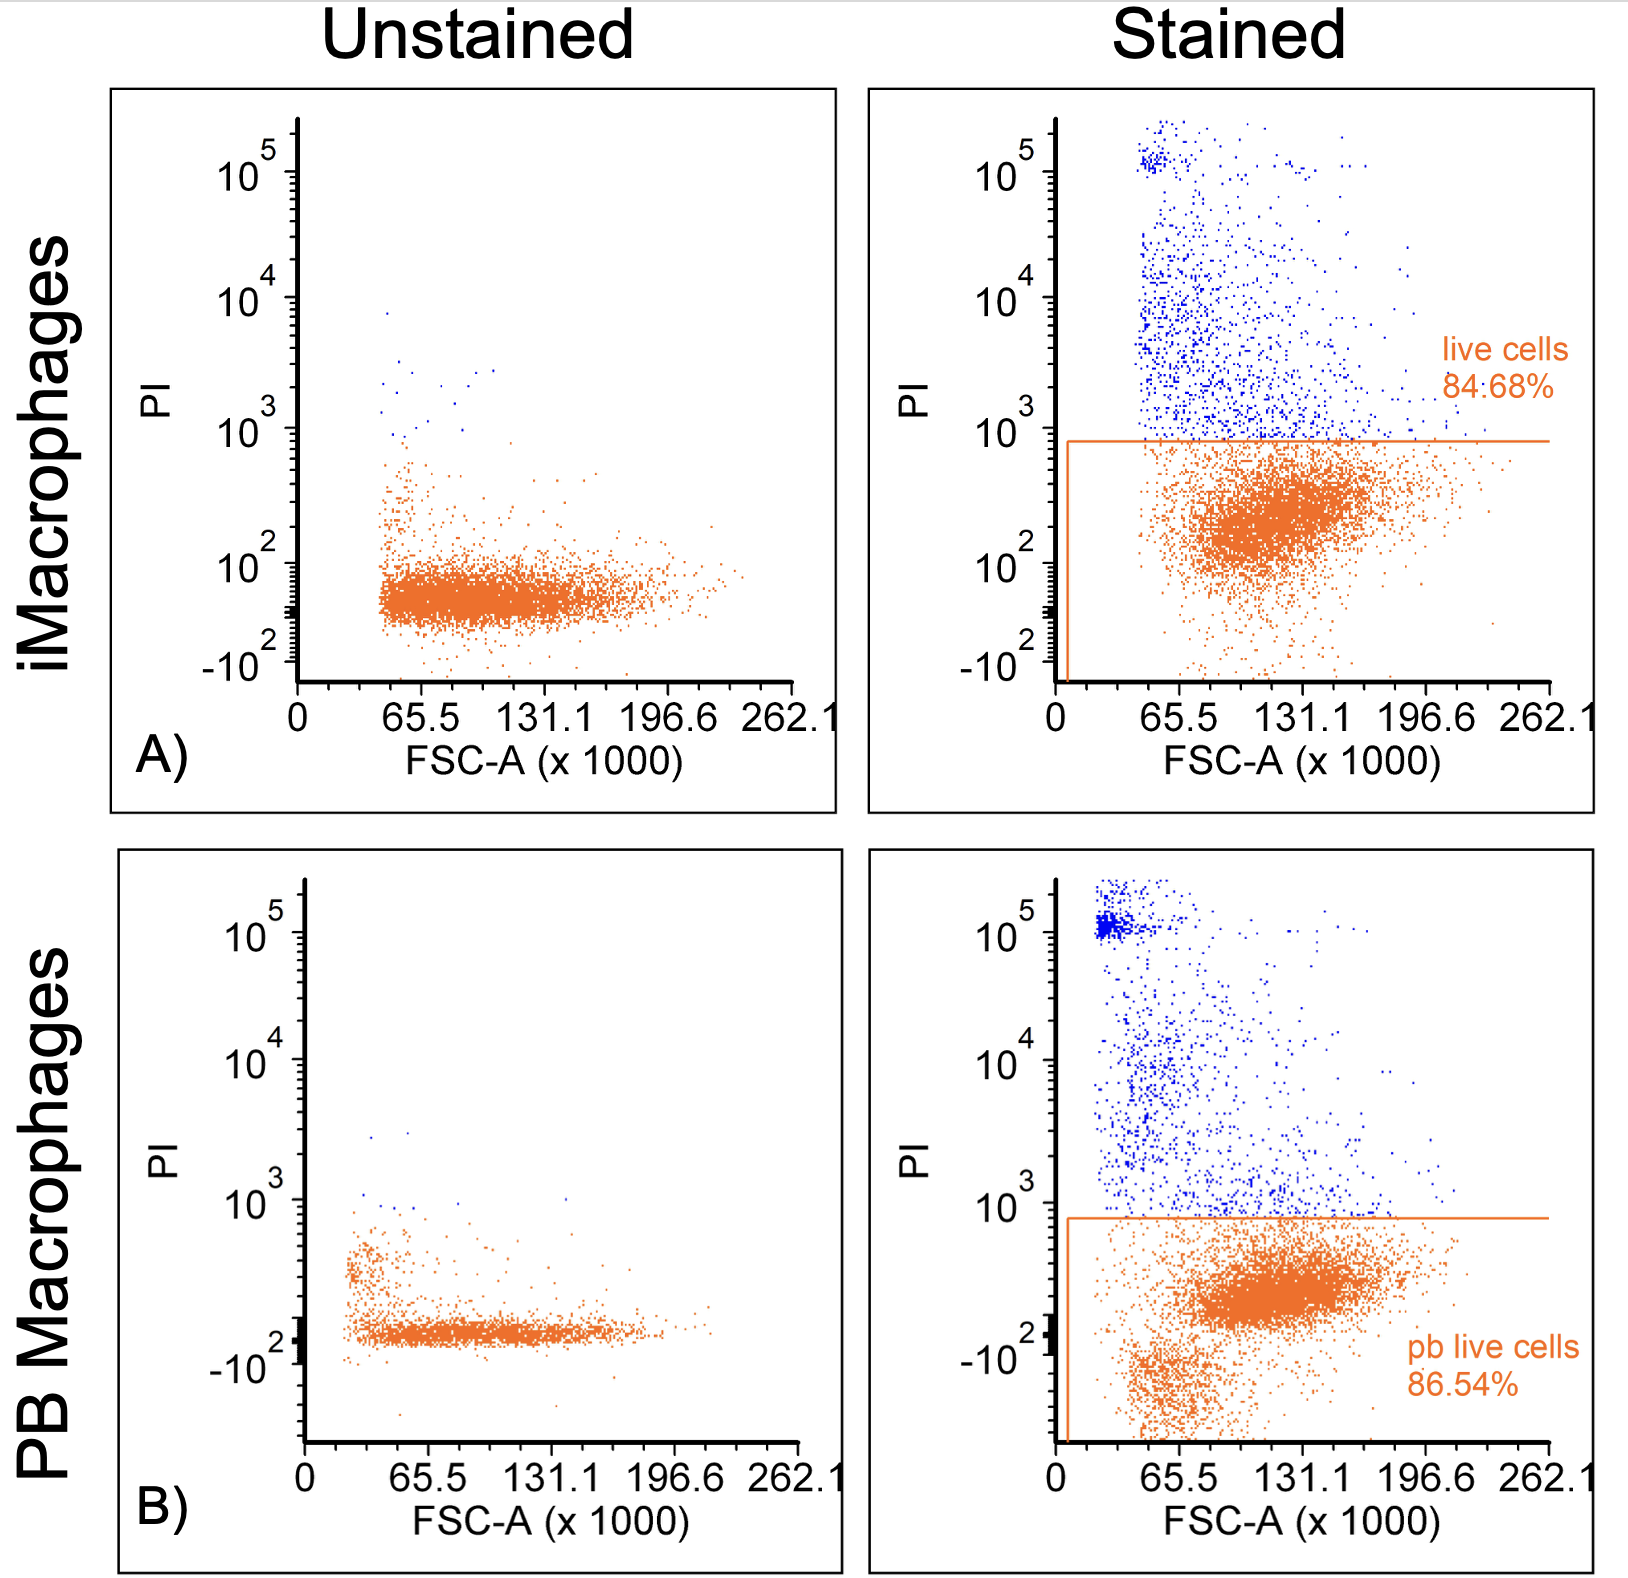
Figure 3. Gating of live cells in iMacrophage (A) and PB macrophage (B) populations.
For iMacrophages and PB macrophages, over 84% of the cell population were live cells. To identify the fibroblast and macrophage populations, antibodies for CD90 and CD45 were used respectively. Gating was done by selecting cell populations that were above unstained control and the fluorescence minus one control (FMO) on the y-axis (Figure 4).
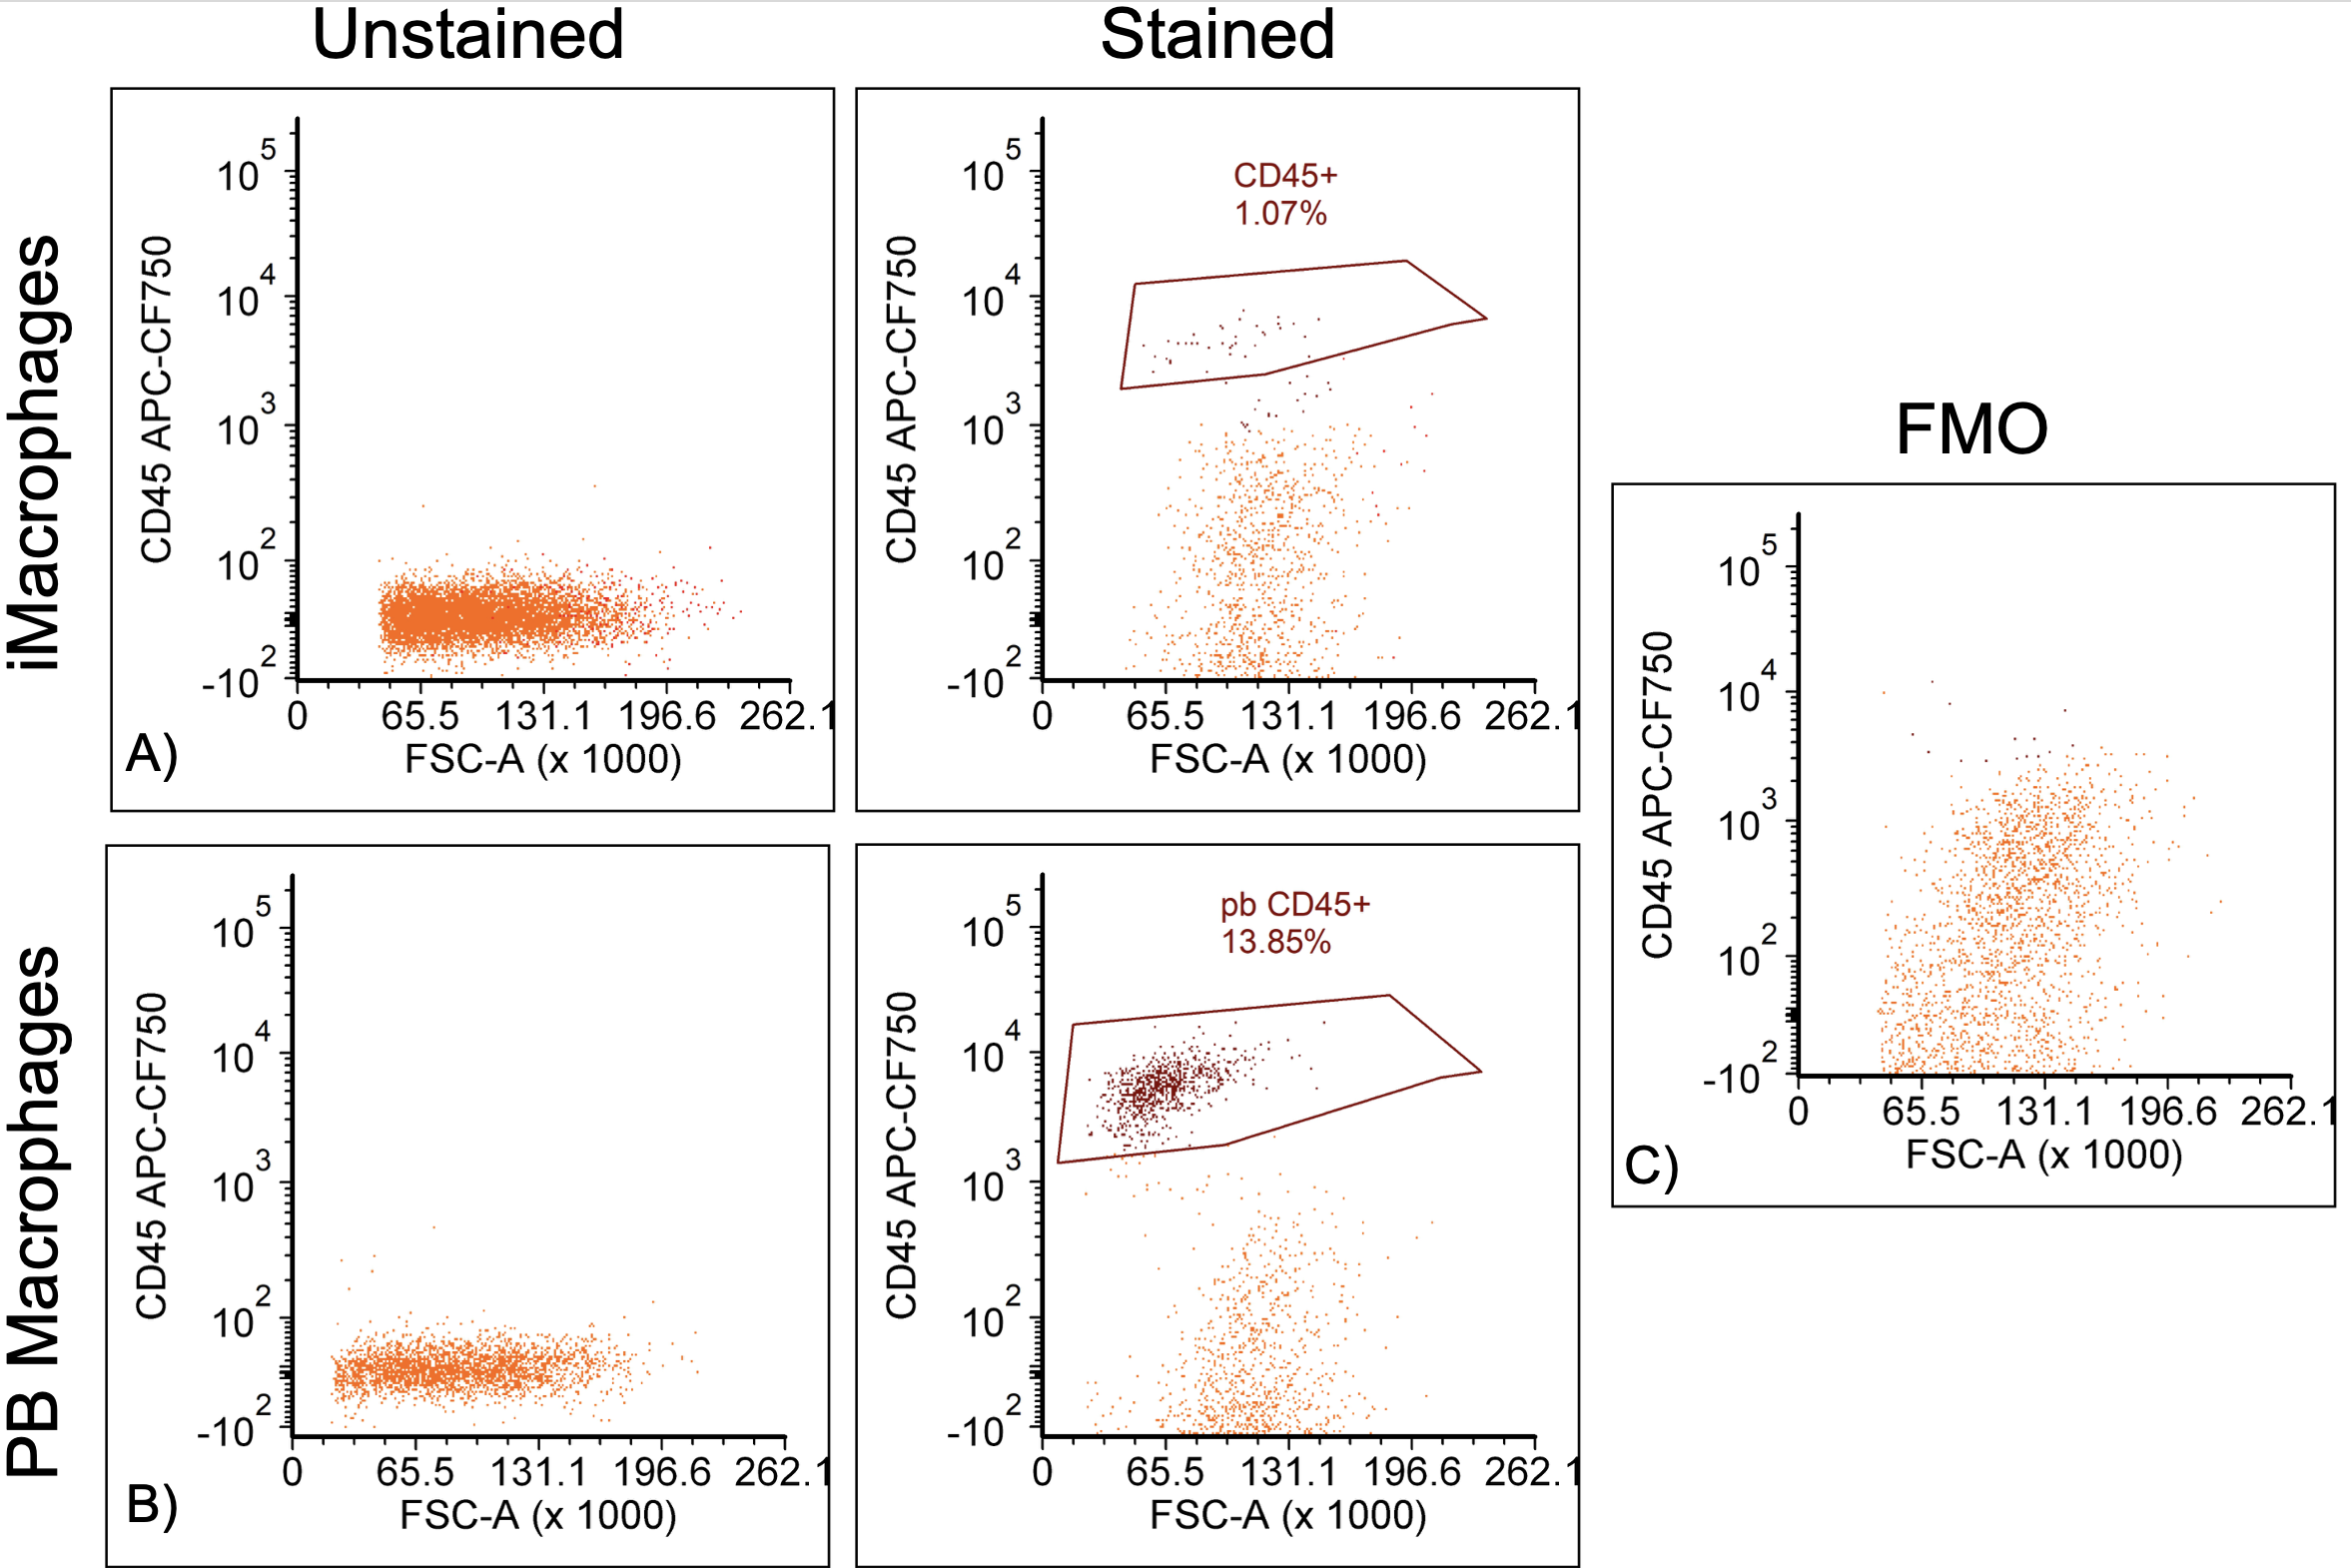
Figure 4. Gating of CD45+ cells for iMacrophages (A) and PB macrophages (B) using unstained controls and fluorescence minus one (FMO) controls (C).
FMOs contain all of the stains that are used in the experiment except for one to distinguish what is a true positive signal in a population. For the hToCs seeded with PB macrophages, 13.85% of the population was positive for CD45. For hToCs seeding with iMacrophages, 1.07% of the population was CD45+. To further identify the macrophage populations, negative gating of CD90 was also done (Figure 5). This allowed us to determine if there was more difficulty digesting iMacrophages out of collagen I gels or if iMacrophages were not expressing the CD45 marker as much as PB macrophages.
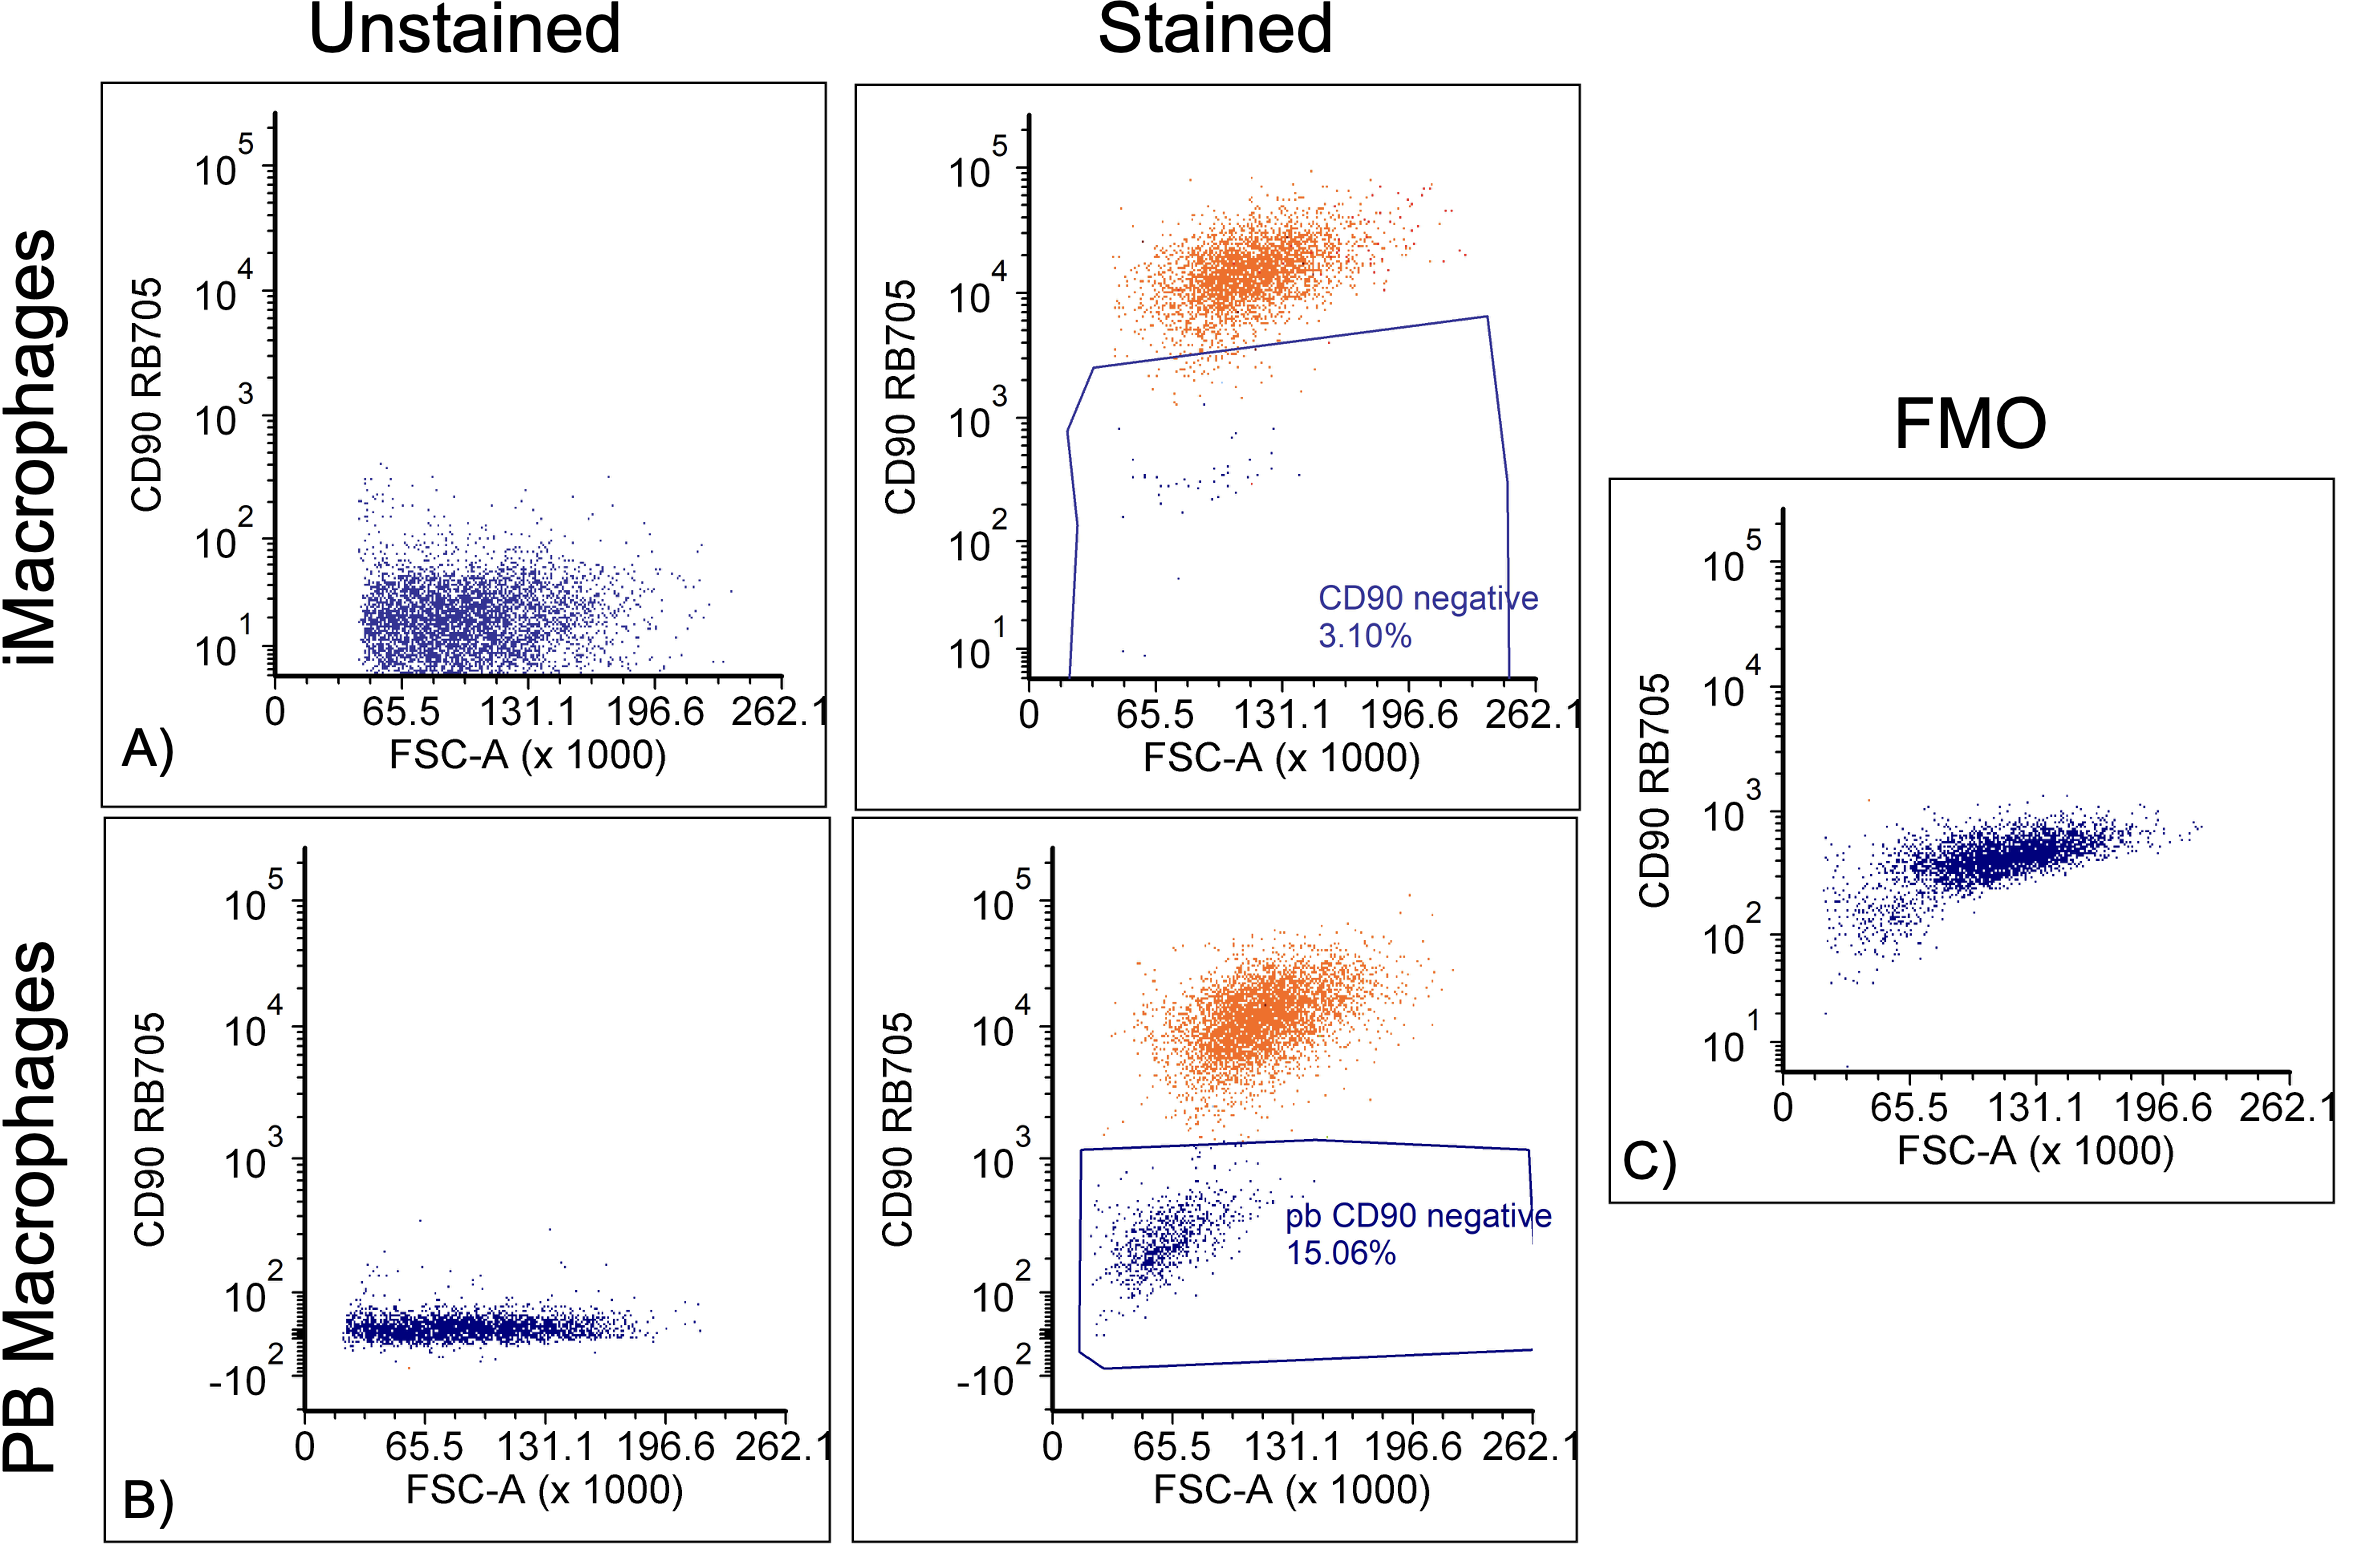
Figure 5. Gating of CD90- cells for iMacrophages (A) and PB macrophages (B) using unstained and FMO controls (C).
For the iMacrophage hToC, 3.10% of the population was CD90- which was similar to the results for CD45+ cells from Figure 4A. It is possible, however, that not all of the iMacrophages express the CD45 marker. For PB macrophage hToCs, 15% of cells were CD90 negative which agreed with the CD45+ population in Figure 4B.
Discussion/Conclusions
From this experiment, we concluded that it is feasible to digest macrophages out of collagen I gels for flow cytometry analysis. For each sample, between 10,000 and 20,000 events were recorded and over 84% of the cell population were live cells in both iMacrophage and PB macrophage hToC devices. This indicates that the digestion procedure was effective and did not result in significant cell death. Additionally, in PB macrophage hToCs, nearly 14% of the population consistently expressed CD45 which agreed with the ~15% CD90 negative population, (Figures 4B and 5B). This demonstrates that PB macrophages survived the 6-day culture with HTEN051 fibroblasts and expressed the expected marker of CD45. For iMacrophage hToCs, CD45 positive expression was much lower at 1.07% and likewise for CD90 negative expression at 3.10% (Figures 4A and 5A). It is possible that iMacrophages did not survive the culture as well as the PB macrophages and therefore there were fewer of them to recover from the digestion. It is also possible that there were some difficulties in the digestion procedure. iMacrophage hToCs may need to incubate in the collagenase/dispase digestion solution for a longer time to fully degrade the collagen gel. More mechanical stimulation may also improve this process. iMacrophages may also not be expressing CD45 as much as PB macrophages. This could be due to immaturity since they are iPSC-derived cells.
Overall, using flow cytometry to evaluate macrophage marker expression from digested hToC gels is a feasible process. The digestion procedure may need some optimization, but the results were generally hopeful. Thank you to Kevin Lee from the Yeh Lab for helping with planning and troubleshooting this experiment.
References
- Ajalik RE, Linares I, Alenchery RG, Zhang VZ, Wright TW, Miller BL, McGrath JL, Awad HA. Human Tendon-on-a-Chip for Modeling the Myofibroblast Microenvironment in Peritendinous Fibrosis. Advanced Healthcare Materials. 2025;14(4):2403116. doi: https://doi.org/10.1002/adhm.202403116.
- Linares I, Chen K, Saffren A, Mansouri M, Abhyankar VV, Miller BL, Begolo S, Awad HA, McGrath JL. Fluid flow impacts endothelial-monocyte interactions in a model of vascular inflammatory fibrosis. Scientific Reports. 2025;15(1):3227. doi: 10.1038/s41598-025-85987-z.
- Ackerman JE, Nichols AE, Studentsova V, Best KT, Knapp E, Loiselle AE. Cell non-autonomous functions of S100a4 drive fibrotic tendon healing. Elife. 2019;8. Epub 20190524. doi: 10.7554/eLife.45342. PubMed PMID: 31124787; PMCID: PMC6546390.
- Wong JKF, Lui YH, Kapacee Z, Kadler KE, Ferguson MWJ, McGrouther DA. The Cellular Biology of Flexor Tendon Adhesion Formation: An Old Problem in a New Paradigm. The American Journal of Pathology. 2009;175(5):1938-51. doi: https://doi.org/10.2353/ajpath.2009.090380.
