Staph Discipline: Pulling Staphylococcus aureus onto the Membrane to Encourage Timely Transmission
Since our attempt to standardize the Staphylococcus aureus µSiM-CA division assay, described here, we have moved towards investigating biological reasons as to why our assay performance is not where we want it to be. While biofilms have been suspect from the beginning, we have also thought that bacterial transmission requires two main steps: 1) Pore discovery and 2) Transmissive division. Believing pore discovery to be the rate limiting step of this process, we looked to artificially accelerate the process by pulling bacteria down on the membrane at the start of our assay. The addition of our pulldown method to our standardized protocol and the results from this approach are shown below.
Standardized Protocol
*Protocol changes shown in red
Preparing the µSiM-CAs for Testing and Loading them with Bacteria
- Ahead of time, prepare Tryptic Soy Broth (TSB) by adding 30 g of BBL Trypticase Soy Broth to 1 L of purified water
- Mix thoroughly and warm gently until powder is completely dissolved
- Autoclave at 121°C for 15 minutes
- Start an overnight culture by scraping up a chunk of glycerol stock with a pipette tip and adding it to 2 mL of TSB
- Take this overnight culture and put it into a shaker, shaking at 37°C overnight
- The next day, create a subculture by adding 1 mL of your overnight culture to 100 mL of TSB
- Put the subculture in a shaker and let grow at 37°C while shaking until it measures an OD between 0.2-0.4
- While the subculture is growing, thoroughly examine each µSiM-CA device you will use for any defects such as improper sealing between components or broken membranes
- Prepare petri dishes to hold µSiM-CA devices by placing 2 Kim Wipes moistened with sterile dH2O along the perimeter of each petri dish
- Pipette ~15 µL of TSB media by inserting the pipette tip into one of the two open ports of the µSiM-CA and depressing the plunger of the pipette; the media should flow from this port through the bottom channel and out the opposite, open port. Remove the pipette tip before releasing the plunger of the pipette to avoid sucking injected fluid back out of the bottom channel of the device
- Fill the well of the µSiM-CA by pipetting 100 µL of fresh TSB into it; care is taken to not create air bubbles and/or remove them by by withdrawing injected media and injecting it again until no air bubbles are visible
- With the bottom channel and well wet, block one of the open ports using a 3M double-sided tape sticker and stabilize the devices with clamps around its sides
- In the same manner as above, pipette ~40 µL of TSB media into the open port and look to see the well fill with little resistance. If resistance is appreciable, discard the device and prepare a new one
- Remove all liquid from the well (~140 µL), then add 15 µL of TSB into the open port
- Next, add 100 µL of the desired OD subculture to the well of each device, withdrawing and injecting the subculture again if air bubbles are present until they are gone
- Withdraw 50 µL of fluid from the open port, sucking fluid from the well through the membrane, into the bottom channel and out the port
- Replenish the well volume to 100 uL by pipetting 35 µL of TSB directly into the well
- Allow the devices to incubate at 37°C for 6 hours
After loading, I imaged the devices at different time points using confocal imaging and the method described below.
Confocal Imaging µSIM-CA Devices Containing GFP Tagged Staphylococcus aureus
- PDMS blocks (~5 mm thick) were laid on top of loaded µSiM-CA devices in order to allow them to be imaged in the microscopy core while maintaining gas permeance
- Any liquid pushed out to the sides of the device is wiped away with a Kim Wipe
- To create an adequate seal, the interface between the PDMS bottom and the acrylic top of the device was sealed with nail polish
- Upon sealing, devices were stored in petri dishes filled with wet Kim Wipes for transport over to river campus
- Once at the microscopy core, images were taken with the 60X water immersion objective and the 1.5X magnifier on the base of the confocal microscope. The 488 nm laser was used with the 525 nm filter
- While imaging, devices were stored in an incubator stage attached the confocal microscope which is held at 37°C
- In between imaging sessions, devices were stored in an oven held at 37°C containing two 1 L beakers of DI water
Results
Pulldown Comparison
To illustrate the difference in bacteria at the surface of the membrane after our pull down modification, I took an image of the membrane inside a µSiM-CA from a previous experiment where we did not pull bacteria down and compared it to a membrane within a µSiM-CA in this experiment at the same time point in Figure 1 below.
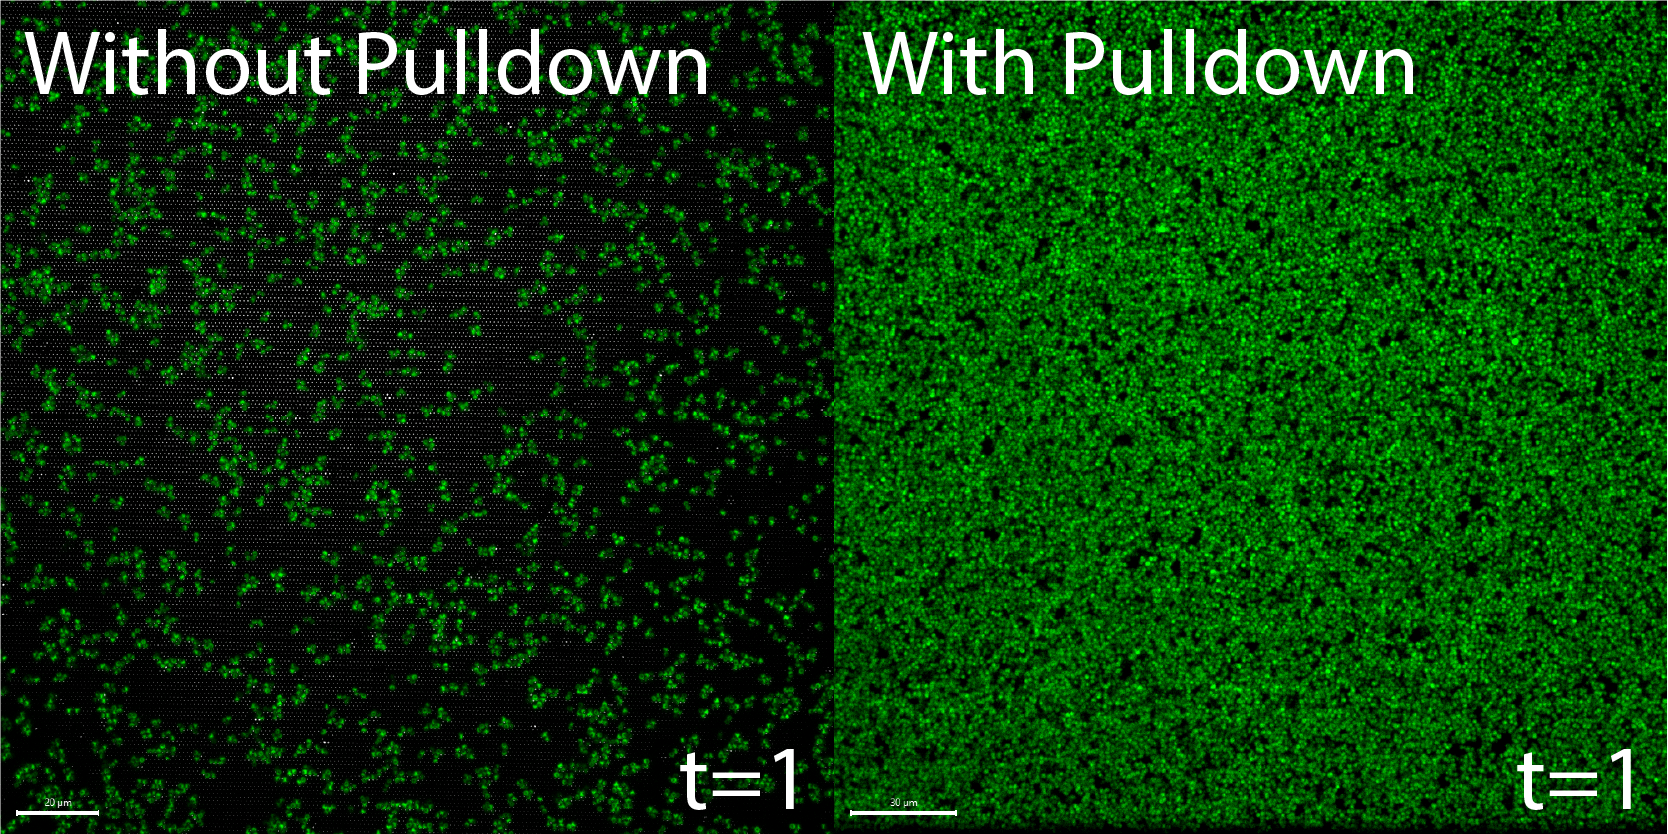
As expected, it is immediately noticeable that there are much more bacteria on the membrane when we pull down compared to when we do not. This tells us that what we are doing is in fact working like we thought it would and we are successfully loading the membrane with bacteria.
Bacterial Transmission
I built 10 µSiM-CA devices and imaged them at three different time points (1 hour, 4 hours, and 6 hours). Compared to our previous attempts which averaged ~50% transmission, our pulldown modification bumped our performance up to 90% after 6 hours. The number of devices with bacteria in their bottom channels is shown in Figure 2 below.
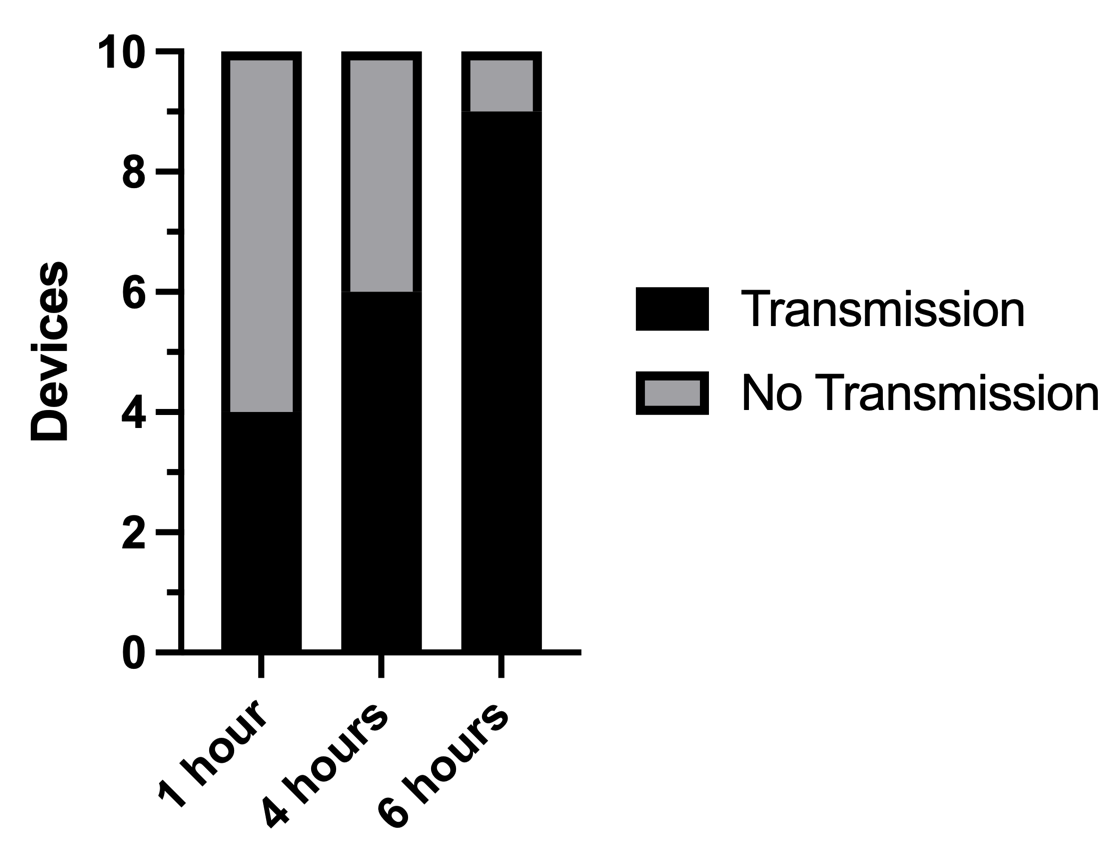
In addition to bumping our transmission within 6 hours up to 90%, this modification also increased the number of devices that had bacteria in their bottom channel within the first few hours of incubation to double of what we have seen before. The images from which the data shown in Figure 2 comes from are shown in Figure 3. Figure 3 shows three different views for the first time point (first the membrane at 60X, then at 90X and finally a 3D view in between the membrane at the top and the bottom channel at the bottom) in each of the ten devices I worked with and then just the 3D view for the last two time points.

From the images shown in Figure 2, we can see that after 1 hour, four devices had bacteria in the bottom channel (Devices 3, 4, 7 and 9). After 4 hours, two more devices have bacteria in their bottom channel (Device 1 and 6) and after 6 hours, three more have bacteria in their bottom channels (Devices 2, 5 and 10). In most devices there is a substantial amount of bacteria in the bottom channel, suggesting similarly positive results would be shown in a CFU analysis.
Evidence of Biofilms
Device 8 was the only device which did not have any bacteria in the bottom channel after 6 hours. Interestingly, it was also the only device which seemed to exhibit a biofilm on its surface at the 6 hour time point. A picture of this potential biofilm is shown in Figure 4 below. A rotating z-stack of the same spot above the membrane is shown in the video linked here: Biofilm Rotation.
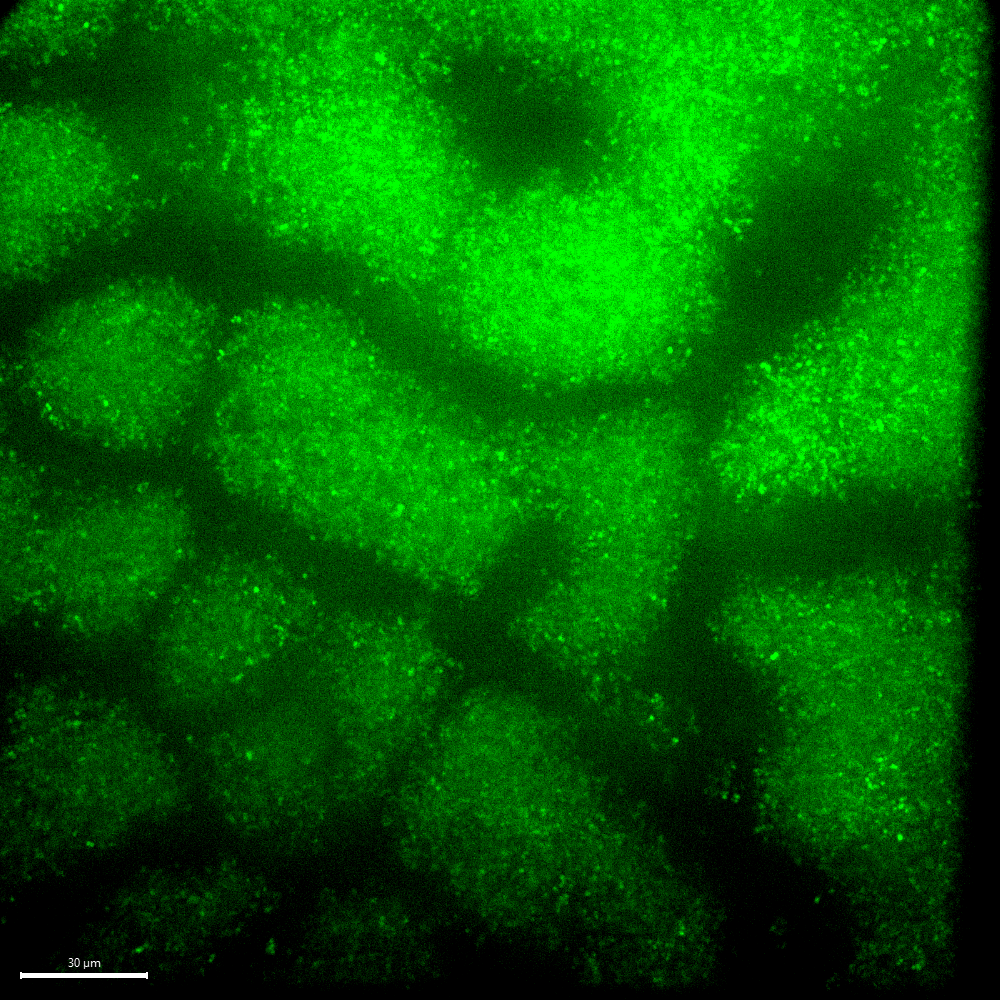
The formation of a biofilm on the membrane could explain why bacteria did not go through the membrane in Device 8 despite our protocol modification. Curious to see if bacteria would ever get to the bottom channel of the device despite the biofilm, we continued to image this device past 6 hours and saw that after 24 hours, bacteria did in fact get to the bottom channel. We also imaged a device which had transmission within 6 hours (Device 4) and another which had very little transmission within 6 hours (Device 10) for comparison. The results are shown in Figure 5 below.

Interestingly, all devices had bacteria in their bottom channel after 24 hours. This suggests that a biofilm on the surface of the membrane does not completely block all of the pores of the membrane, but instead hinders access to the pores increasing the time it takes for bacteria to find a pore. This may provide more evidence that pore discovery is the rate limiting step in the bacterial transmission process. Expectedly, the two devices which had little or no bacteria in their bottom channels after 6 hours had less bacteria in their bottom channels after 24 hours than the device which had a substantial amount of bacteria in its bottom channel after 6 hours.
Bacterial Budding
Another phenomena which we had not seen in any of our attempts before but was seen in this experiment was what looked to be bacterial budding. Shown in Figure 6 below, a look at the side of some of the membranes which had bacteria in the bottom channel showed bacteria hanging on to the bottom side of the membrane.

An alternative view showing the the top, middle and bottom of the membrane in Device 4 can be seen in Figure 7 below. For comparison, these confocal images are shown next to a Scanning Electron Microscope (SEM) image of the original budding phenomena imaged by Karen Bentley in the past for Elysia Masters (Masters, Elysia A et al. “An in vitro platform for elucidating the molecular genetics of S. aureus invasion of the osteocyte lacuno-canalicular network during chronic osteomyelitis.” Nanomedicine : nanotechnology, biology, and medicine vol. 21 (2019): 102039. doi:10.1016/j.nano.2019.102039).

The bottom membrane confocal image is strikingly similar to the electron microscope image shown on the right. This encouraged us, leading us to believe that we were in fact seeing bacterial budding like we thought we were.
Conclusions and Future Directions
Overall, the bump in transmission success (from ~50% to 90%) suggests that our thoughts about the bacterial transmission process including a rate limiting step of pore discovery seem to be grounded in some truth. The presence of a biofilm on the membrane of the only device that did not have bacteria in the bottom channel within 6 hours also seems to suggest a straightforward and understandable hurdle which we could choose to try to tackle next (if further protocol optimization is desired). Finally, the observation of bacterial budding on the bottom side of the membrane provides reassurance that our protocol is performing in a manner which is somewhat familiar to us since it is reminiscent of observations we have made in the past. Before choosing what to tackle next, we will repeat this experiment to gauge its reproducibility and check to see if we are pulling bacteria through the membrane with our pull down modification. If all goes well, we will have our collaborators use our modification and see if they too have a similar level of success.