Development of a TEER module for barrier tissue characterization
Introduction
Tissue barriers separate different compartments of body organs. These barriers regulate the absorption of nutrients, maintain homeostasis, and prevent toxins from entering. In vitro models of tissue barriers have been developed to understand human diseases and investigate drug toxicity and effectiveness. In order to investigate cell-cell junctions and barrier maturity created on these models, early research deploys permeation or diffusion tests to quantify the integrity of the junctions. In these tests, the flux of tracers with defined molecular sizes, from the apical compartment of the junction to the basal, provides the permeability coefficients [1]. However, most tracers may affect barrier properties, moreover, since such permeation evaluation relies on the flux of tracers, continuous measurements are not possible [2]. Trans-epithelial/endothelial electrical resistance (TEER) measurements offer a non-destructive and real-time method to quantitatively evaluate the integrity of tissue barriers. By applying a small AC current (10 µA, 12.5 Hz), the impedance measurements over different time points can present the progression of the tightness of the barriers [3]. When cell monolayer becomes confluent during incubation, pores of the membrane are covered by cells, preventing conductive ionic microchannels. And when the cells start forming tight junctions, the impedance of the paracellular pathway for ionic current becomes higher – the tightness of the tissue junctions is proportional to the measured electrical resistance. For an ease-of-use TEER measuring method, we introduce a magnetic-based latch-on TEER module with fixed electrode positions into the m-µSiM platform. For preliminary experiments, we seeded human umbilical vein endothelial cells (HUVECs) on NPN membranes in the open-well format.
Theory
How TEER works
Cell layers can be modeled as an electrical analogy of a resistance and a capacitor as seen in Fig. 1. The resistance represents paracellular pathway related to cell-cell junctions and the transcellular pathway would be dominated by the capacitance of the cellular membrane/lipid layer. When we look into DC measurements or AC at relatively low frequencies (f -> 0Hz), the capacitance of the circuit (transcellular pathway) is considered fully charged and current cannot flow through the transcellular pathway. The tight junctions (paracellular pathway) in this scenario provide the major contribution to the impedance measured. Conversely, when the frequency of the voltage applied increases (f -> ∞), high-frequency current can flow through the transcellular pathway, thus lowering the overall impedance of the cell monolayer [4].
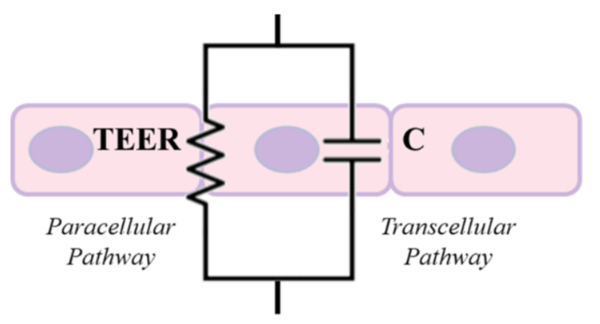
Fig. 1 A simple electric circuit analogy of the tissue barrier TEER measurements. For DC or low-frequency AC stimulations, the transcellular pathway, as represented as a capacitor, is considered fully charged as an open-circuit, while the paracellular pathway is represented as a resistor. [Figure captured from [5]]
Ideally, the resistance of paracellular pathway should be measured via DC electric field to quantify the tightness of junctions. However, since cell media are full of electrolytes, applying a DC voltage across the pair of electrodes may cause charging during the measurement period. This can lead to the pitting corrosion of electrodes, resulting in the passivity of the electrodes and releasing undesirable metal ions which can be detrimental to cells [6]. Therefore, conventional TEER measuring methods use AC signal stimulations in the low-frequency regime, where the capacitance can still be considered as an open-circuit, to represent a DC measurement.
When the cell monolayer is not fully confluent across the porous membrane (m-µSiM), pores of the membrane, immersed in cell media, act as small ionic microchannels, allowing ionic current to flow through with a much smaller resistance.
Since the DC or low-frequency AC signals represent the paracellular pathway of the barrier, the electric circuit analogy of the TEER measurement setup with the cell-media-immersed well and the porous membrane can be represented as Fig. 2. The conventional protocol is to subtract each raw impedance measurement with cultured cells by a blank impedance of the same device setup but without cells.
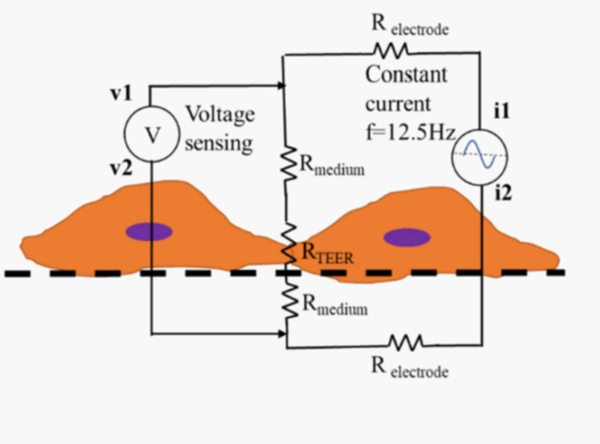
Fig. 2 The electric circuit analogy of the TEER measurement setup with tissue barrier, porous membrane, and cell-media-immersed system. Since we apply low-frequency AC signal for impedance measurements, we consider the paracellular pathway resistance (RTEER) as the predominant factor of the measured impedance.
Materials and Methods
Device fabrication
To create an accessible latch-on module compatible with the existing m-µSiM platform, we fabricated the TEER module and the lower housing for m-µSiM by laser-cutting acrylic sheets with thicknesses of 2 and 3.5 mm, respectively. The lower housing was bonded to a coverslip substrate using pressure-sensitive adhesive. Since commercial TEER readings with EVOM2 are highly dependent on the positions of the chopsticks electrodes positions (Srinivasan 2015), we design the TEER module with two electrodes fixed by 001 O-rings. The module included two bonded acrylic layers to provide a stop of the O-ring to prevent slipping of the O-rings and thus of the electrodes. The module fits on the m-uSiM based on magnetic latching between magnets embedded in the TEER module and lower housing as seen in Fig. 3.
Nickel-plated NdFeB magnets with a diameter of 4.75 mm and pull force of 0.34 kg (K&J Magnetics, USA) were press-fit into the TEER module and the lower housing to realize magnetic latching.
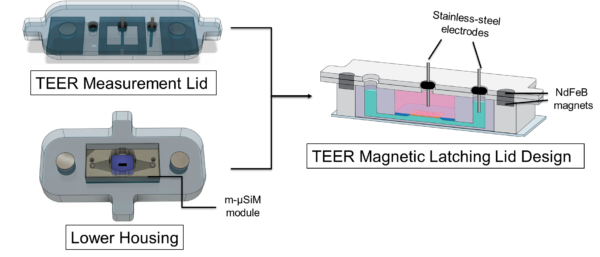
Fig. 3 The TEER module and the lower housing of the m-µSiM module were fabricated by pressure adhesive taping acrylic sheets and cover slips
Cell culture
Human umbilical vein endothelial cells (HUVECs) were cultured in EBM-2 Basal Medium supplemented with EGM-2 Endothelial Cell Growth Medium-2 BulletKit. HUVECs were used between passages 2-6. To improve cell attachment, m-μSiM membrane was coated with 5 μg/cm2 fibronectin for 1 hour at room temperature. The cells were seeded at a density of 50,000 cells/cm2.
TEER measurements
By using a potentiostat (Reference 600, Gamry Instruments Inc.), we performed the impedance spectroscopy over a frequency sweep. As literature has shown that DC current can be detrimental to cells and lead to electrode polarization, we ran the measurements with AC current at 10μA (Srinivasan 2015, Chen 2018). Since the impedance measurements drop for frequencies past 1 kHz due to the predominance of the capacitance of cell membranes, we ran the impedance spectroscopy with the frequency sweep from 2.5 Hz to 250 Hz [5]. Performing the impedance spectroscopy provides us more detailed parameters for geometrical improvements in later design iterations. Currently, we report our 12.5 Hz measurements to be consistent with the conventional EVOM TEER numbers in literature. We then took blank impedance measurements of the same setups without cells. The raw measurements subtracted by the blank impedance would provide the impedance of cell-cell junctions (paracellular pathway) [7].
Since resistance measurements can be position-sensitive, we include an electrode-position test with a few electrode-position combinations. The position combinations are shown in Fig. 4. Position 1 indicates the normal setup, where we placed the electrodes at the lowest possible position. We then raised the bottom channel electrode by 1.5 mm with a PMMA sheet for position 2. Position 3 indicates a 1.5-mm-raised well electrode, and position 4 refers to the combination where both electrodes were raised by 1.5 mm.
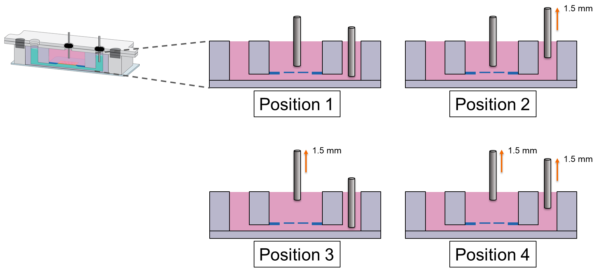
Fig. 4 Electrode position test in the TEER module. Position 1 refers the usual measurement electrode position. Position 2 indicates a 1.5-mm raise of the bottom-channel electrode while the open-well electrode is at the original height. Position 3 has the open-well electrode lifted by 1.5 mm while the bottom channel electrode remains at its original position. Position 4 involves 1.5-mm raises of both the open-well and the bottom-channel electrodes.
Results and Discussion
TEER module on the m-µSiM platform
The magnetic latching approach allows users to seed cells and establish a monolayer in the open-well format as shown in Video. 1. Once the cell monolayer is confluent, the user can insert the TEER module to characterize barrier resistance. Then, the TEER module can be removed to conduct the rest of the experiment in the open-well format. When taking TEER measurements, the Gamry Reference 600’s alligator clips can easily clamp onto the stainless-steel gauge (Figure 5).
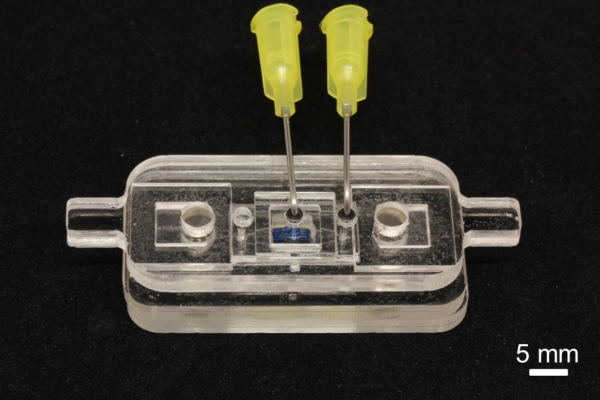
Fig. 5 The fabricated TEER latch-on module on the m-µSiM platform. The device includes 2-layer design for fixing the O-rings and thus the electrodes (stainless-steel gauge 20G). Alligator clips of the Gamry Reference 600 potentiostat can clamp on the electrodes.
Electrode-position test
The 4-position tests see impedances at 25.2±0.06, 26.6±0.07, 26.0±0.06, and 27.6±0.18 kΩ (n=5), as shown in Fig. 6. Position 1 and position 4 are the most different groups in impedance measurements but only yielded a 9.6% difference in the measured values. In our test setup, the electrode positions, with the aid of the O-rings, should not provide a significant fluctuation in our TEER readings. The test is performed at room temperature without fibronectin coating.
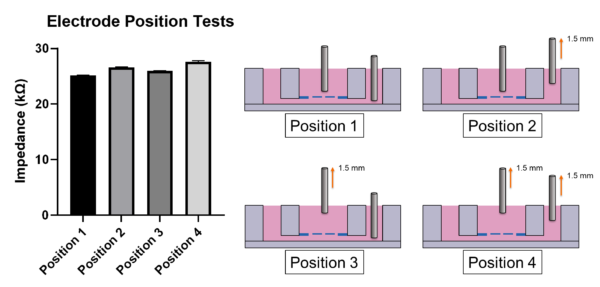
Fig. 6 The TEER module’s electrode-position test. Position 1-4 yielded impedances of 25.2±0.06, 26.6±0.07, 26.0±0.06, and 27.6±0.18 kΩ. A cross-sectional view of the schematic of corresponding positions is included.
TEER measurements
We took measurements over 10 cell-seeded devices and 3 blank devices with m-µSiM setups.
Where Z(TEER) indicates the impedance of cell-cell junctions, Z(Raw) refers to the impedance measured using the potentiostat, and Z(blank) refers to the blank device impedance measurements. consists of the impedance of (m-µSiM + fibronectin-coating + cell media + electrodes). The blank devices were measured to have an impedance of 30.2 ± 2.4kΩ. The impedances of the devices seeded with HUVECs measured at 48, 72, and 96 hours are 37.8 ± 4.0kΩ, 45.8 ± 8.6kΩ, 85.7 ± 21.0kΩ, respectively.
TEER (norm) = Z(TEER)*Porous membrane area
To allow a more comparable value to literature, values are often reported by multiplying Z(TEER) by the surface area of the porous membrane where cells are grown. The porous window of the m-µSiM is 2 mm x 0.7 mm, yielding us a surface area of 0.014 cm2. Our normalized TEER values (TEER-norm), are 107.0 ± 56.5, 214.7 ± 120.8, 776.9 ± 293.3 Ω· cm2. Literature has shown that the TEER value of HUVECs when measured at the confluence, is around 70 Ω· cm2 [8]–[10]. Blood-brain barrier models, however, demonstrated a very broad range of reported TEER values, and culture platforms also seemed to have a huge impact on those values [3].
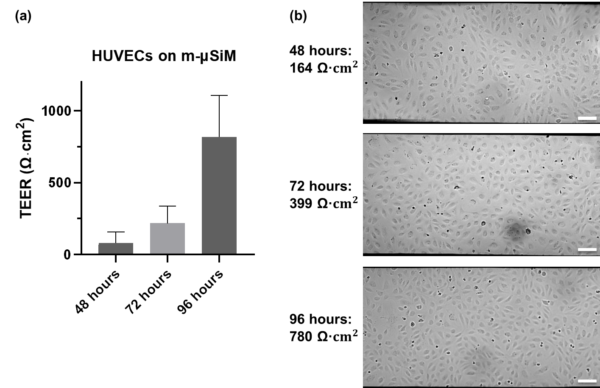
Fig. 7 The TEER measurement results across 10 devices. (a) Our normalized TEER values are 107.0 ± 56.5, 214.7 ± 120.8, 776.9 ± 293.3 Ω· cm2, for the 48, 72, and 96-hour groups. (b) Bright-field images of HUVECs on the m-µSiM platform at 48, 72, and 96-hour marks with corresponding TEER values were reported.
Conclusion and Future Work
We develop a latch-on TEER module compatible with the existing m-µSiM platform (Mansouri et al., 2022). The module consists of O-rings for fixing electrode positions, stainless-steel electrodes, and NdFeB magnets for ease-of-use latch-on capability. As HUVECs form confluence, we measured the TEER values and found that the impedance trended upwards, indicating the formation of tighter junctions over time. Moreover, the current latch-on TEER module design does not see lowered values over the measurement time points, suggesting that the latch-on module does not significantly affect the cells cultured on the m-µSiM membrane.
The m-µSiM platform allows us to perform cell culture with two formats: (1) open-well and (2) flow-driven. We have demonstrated the open-well measurement capability with this latch-on TEER module. In the flow-driven culture format, we incorporate a PDMS-based flow module in the m-µSiM platform to drive flows using dispensing tips and take TEER measurements periodically to evaluate the cell-cell junctions. Since our current electrode setup allows us to use stainless-steel dispensing tips for measurements, this provides the opportunity to take TEER measurements without removing the flow module as illustrated in Fig. 8 for the microfluidic flow driving format. This would allow us to investigate the effect of applied shear on cell-cell junction integrity.
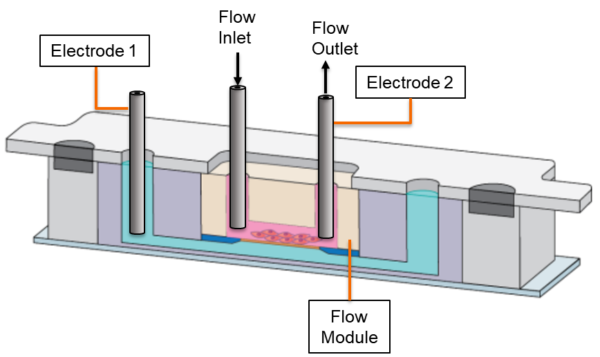
Fig. 8 The TEER measurement setup in the microfluidic format. This setup provides an opportunity to take TEER measurements without constantly removing and plugging the flow module, which can be detrimental to the formed tissue barriers.
Future work would also feature different types of cell lines (e.g., Caco-2) with reported TEER values that have shown excellent tissue barrier formations. Moreover, obtaining TEER values for co-cultures of endothelial cells with pericytes or astrocytes can also provide valuable insights when creating in vitro models of tissue barriers, as endothelial cells are responsible for forming junctions, both pericytes and astrocytes seem to participate in the formation.
Reference
[1] A. Zelman, “MEMBRANE PERMEABILITY GENERALIZATION OF THE REFLECTION COEFFICIENT METHOD OF DESCRIBING VOLUME AND SOLUTE FLOWS.”
[2] K. Felix, S. Tobias, H. Jan, S. Nicolas, and M. Michael, “Measurements of transepithelial electrical resistance (TEER) are affected by junctional length in immature epithelial monolayers,” Histochem. Cell Biol., vol. 156, no. 6, pp. 609–616, Dec. 2021, doi: 10.1007/s00418-021-02026-4.
[3] B. Srinivasan, A. R. Kolli, M. B. Esch, H. E. Abaci, M. L. Shuler, and J. J. Hickman, “TEER Measurement Techniques for In Vitro Barrier Model Systems,” Journal of Laboratory Automation, vol. 20, no. 2. SAGE Publications Inc., pp. 107–126, Apr. 01, 2015, doi: 10.1177/2211068214561025.
[4] D. Günzel et al., “From TER to trans- and paracellular resistance: Lessons from impedance spectroscopy,” Annals of the New York Academy of Sciences, vol. 1257, no. 1. Blackwell Publishing Inc., pp. 142–151, 2012, doi: 10.1111/j.1749-6632.2012.06540.x.
[5] L. Cacopardo et al., “Real-time cellular impedance monitoring and imaging of biological barriers in a dual-flow membrane bioreactor,” Biosens. Bioelectron., vol. 140, Sep. 2019, doi: 10.1016/j.bios.2019.111340.
[6] Y. Tsutsumi, A. Nishikata, and T. Tsuru, “Initial Stage of Pitting Corrosion of Type 304 Stainless Steel under Thin Electrolyte Layers Containing Chloride Ions,” J. Electrochem. Soc., vol. 152, no. 9, p. B358, 2005, doi: 10.1149/1.1992470.
[7] K. Benson, S. Cramer, and H.-J. Galla, “Impedance-based cell monitoring: barrier properties and beyond,” 2013. [Online]. Available: http://www.fluidsbarrierscns.com/content/10/1/5.
[8] D. Kim, S. Eom, S. M. Park, H. Hong, and D. S. Kim, “A collagen gel-coated, aligned nanofiber membrane for enhanced endothelial barrier function,” Sci. Rep., vol. 9, no. 1, Dec. 2019, doi: 10.1038/s41598-019-51560-8.
[9] S. Man, E. E. Ubogu, K. A. Williams, B. Tucky, M. K. Callahan, and R. M. Ransohoff, “Human brain microvascular endothelial cells and umbilical vein endothelial cells differentially facilitate leukocyte recruitment and utilize chemokines for T cell migration,” Clin. Dev. Immunol., vol. 2008, 2008, doi: 10.1155/2008/384982.
[10] B. E. Dewi, T. Takasaki, and I. Kurane, “In vitro assessment of human endothelial cell permeability: Effects of inflammatory cytokines and dengue virus infection,” J. Virol. Methods, vol. 121, no. 2, pp. 171–180, Nov. 2004, doi: 10.1016/j.jviromet.2004.06.013.