Membrane Permeability Testing
Summary of Results
| Membrane | Pore Diameter | Thickness | Porosity | Permeability (cc/cm^2*min*bar) |
| SiN | 3.2-4.0 um | 0.12 um | 22.1%-35.3% | 30000 |
| PCTE | 2.4-3.0 um | 9 um | 11.9%-16.1% | 1652 |
SiN Experimental Design
Permeability of the 3 um pore Si Nitride membranes was assessed using the pictured apparatus:
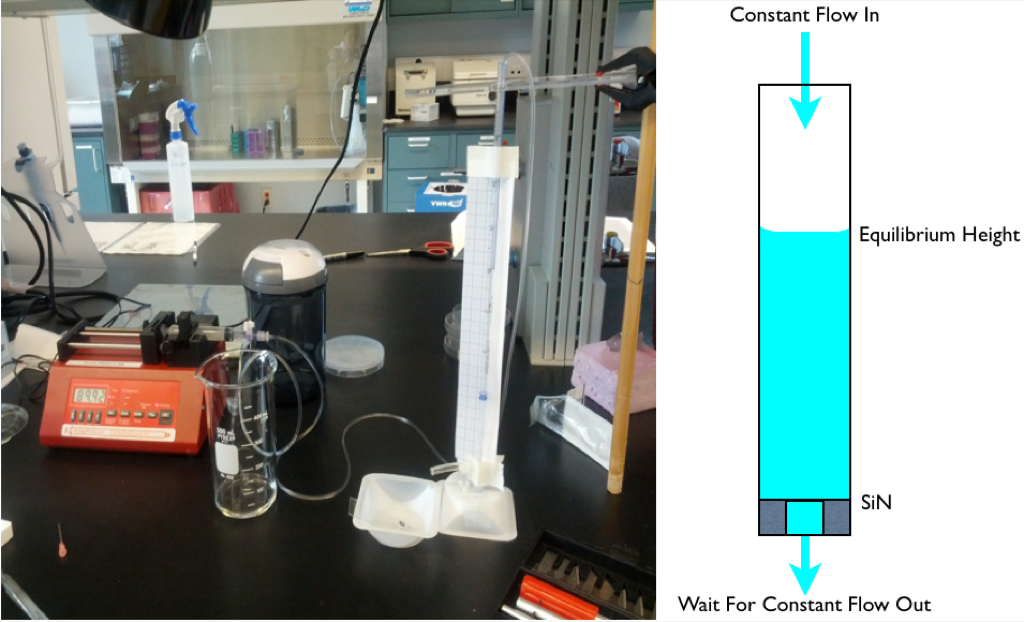
Fluid (ultrapure water) was pumped at a constant rate into a pipet whereupon it was passed through the nitride membrane and out into a fluid collection bin. After a short time of pumping an equilibrium height was established within the pipet and measured. This height can be used to find the pressure difference across the membrane for various flow rates.
The same test was conducted but with a nitride membrane which had been destroyed as a control. This provided the equilibrium heights based only on the system resistance and should allow for correction of the experimental data to neglect non-membrane variables (though this did not work out as will be explained later).
Experimental Results
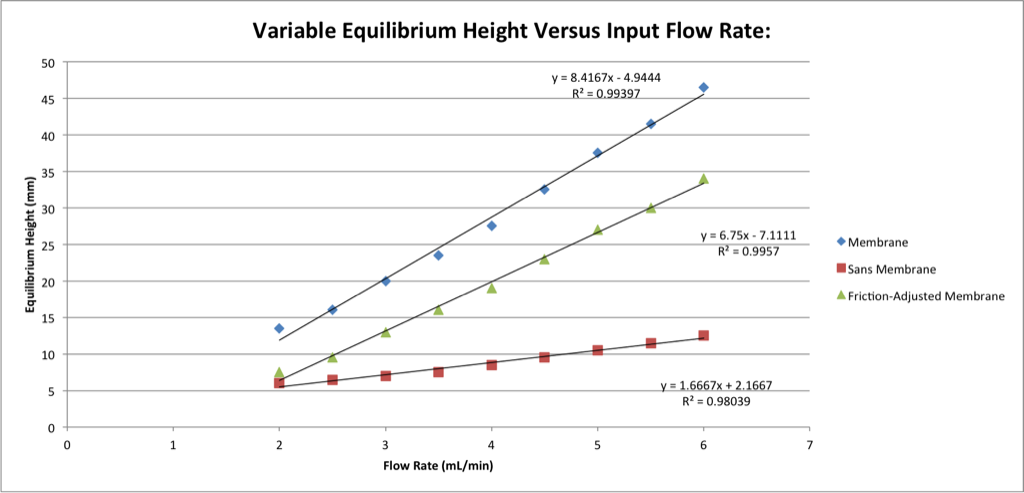
In an attempt to adjust for the effects of system friction, the equilibrium height measured for control was simply subtracted from the height measured during the experimental trials (since pressure is linearly dependent on water column height). As expected, the system with membrane developed a higher equilibrium height than the control (since it is less permeable). The pressures also increased linearly with flow rates (which is expected since they are linearly related in simplified theory).
The theoretical flow rates through the membrane at various pressures were calculated using the Dagan equation as follows:
Q=(P*r^3*n)/(mu*(3+(8/pi)*(l/r)))
where r is the radius of the pores, n is the total number of pores, P is the pressure differential over the membrane (given by the pressure of the water column), mu is the viscosity of water, and l is the thickness of the membrane. The diameters of the pores were found by TEM inspection to be between 3.184 um and 4.020 um with a small-sample average of 3.63 um. The average membrane window size was found to be 2013.5 um across, leading to a value of n of 112616 (representing a 28.7% porosity). These values (with the upper and lower pore sizes providing error bars) give the following theoretical flow rates in response to various pressures:
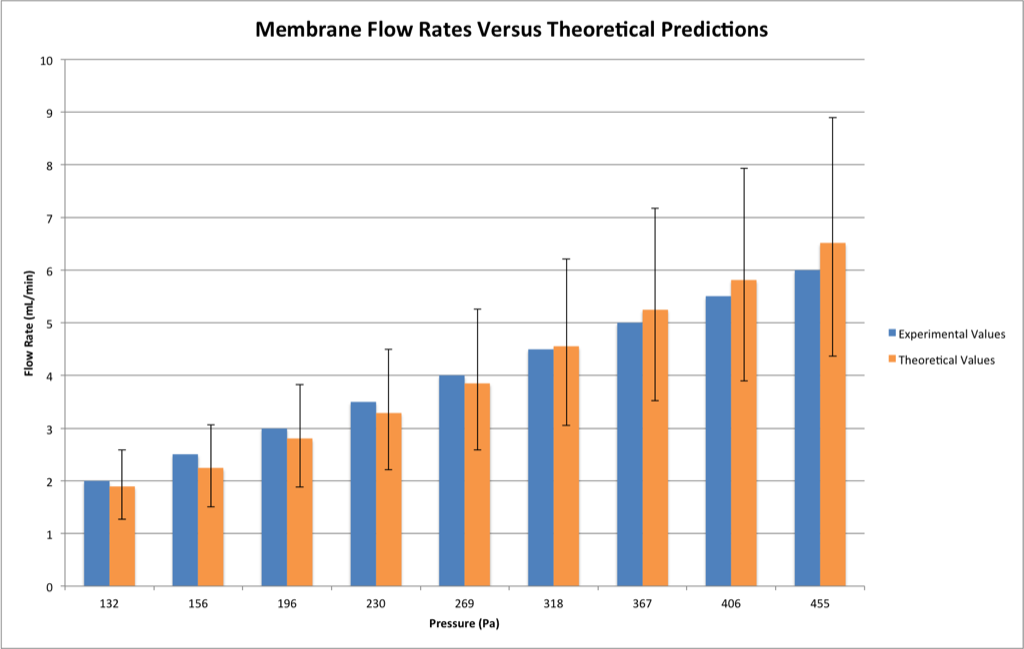
The agreement between experimental and theoretical values was quite good, being very close to the expected values and well within error bounds in each case. Using the adjusted values however, the alignment between theory and measurement becomes much worse:
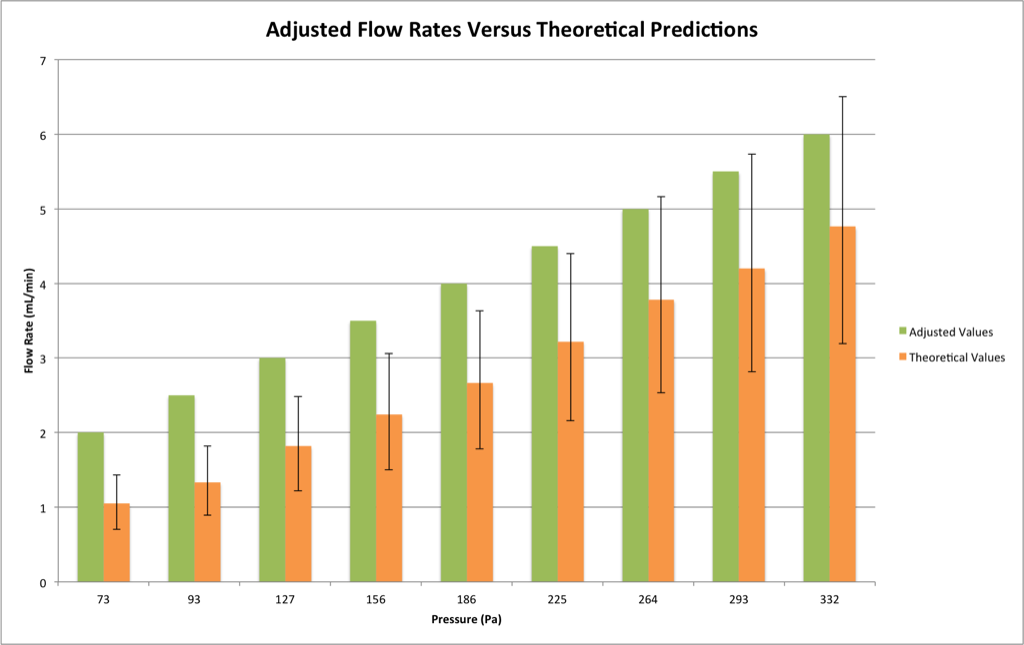
The adjusted values are outside of even the incredibly forgiving error bars in almost every case. It could be that the experiment was simply not as well executed as the pure data seem to imply, but I think it more likely that the method of adjustment oversimplified the system given the following values of membrane permeability versus flow rate:
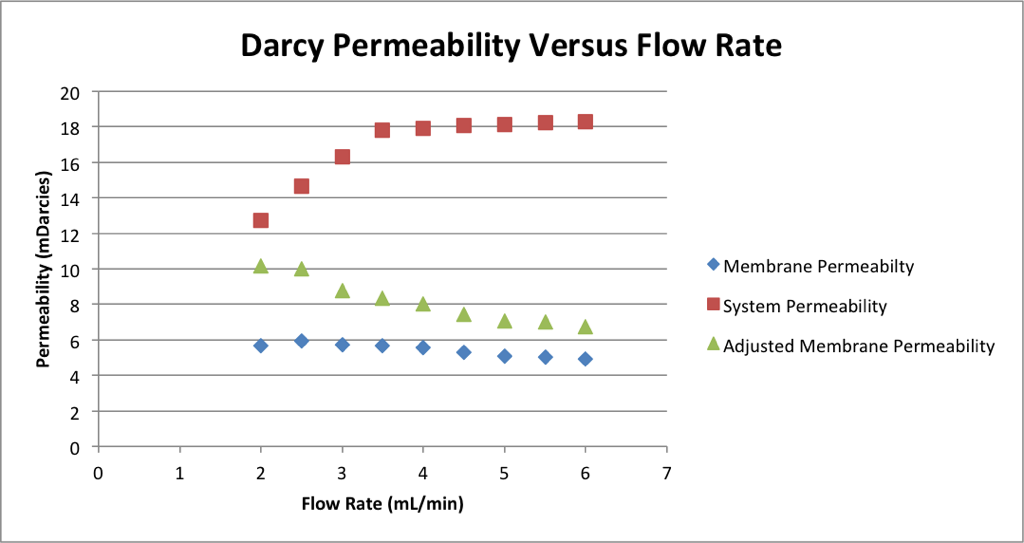
Permeability should be constant with flow rate as it is in the case of the membrane permeability trials and the latter points of the system permeability trial. The system permeability seems to increase linearly over low pressures, possibly as a byproduct of the fact that the system was prone to drip rather than flow continuously. Static friction at low pressures could have driven the resistance higher than kinetic friction normally would have, thereby driving down permeability measurements at low pressures. This in turn would cause problems with the adjusted values until the system started behaving properly. As the graph shows, the adjusted values seem to trend towards the measured ones at higher pressures. This matches with the theory trends from before (where the adjusted values started lining up better with theory as pressure increased). Given this, it seems most appropriate to simply use the unadjusted membrane permeability values.
These values give an average permeability of 5.4 milliDarcies. This makes the membranes as permeable as stratigraphic sandstone in San Juan, New Mexico. This stone has a porosity of 15% and pore sizes on the order of 2+ microns. These values are on the same order as those of the membrane, so this value does not seem unreasonable.
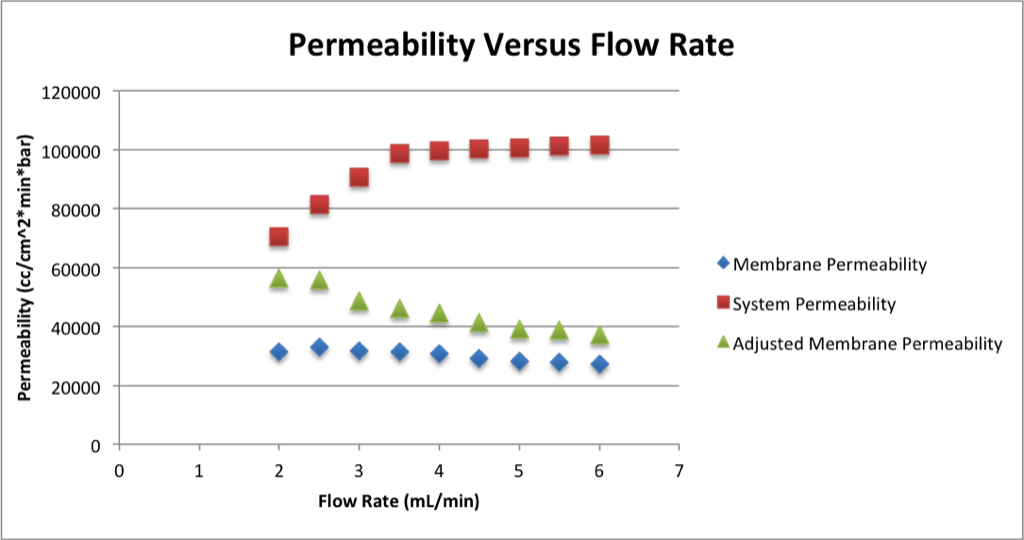
Given in different units, which do not account for membrane thickness, the same trends can be observed:
Conclusion
In these units the average membrane permeability is 30,000 cc/cm^2*min*bar with a standard deviation of 2,000 cc/cm^2*min*bar. For comparison, the 2010 ACS Nano paper on nanoparticle separation found that 13.5% porous, 13 nm hole membranes had a permeability of roughly 40 cc/cm^2*min*bar. While this value is three orders of magnitude smaller than the permeability found for the nitride membranes, the nanomembrane pores are also two orders of magnitude smaller with a porosity less than half of that of the microporous membrane. It therefore makes sense that the permeability values would be significantly different.
PCTE Experimental Setup
Three-micron polycarbonate track etched membranes were also evaluated by running a constant height of water through the membrane and tracking the mass flow rate onto a balance. The results were as follows:
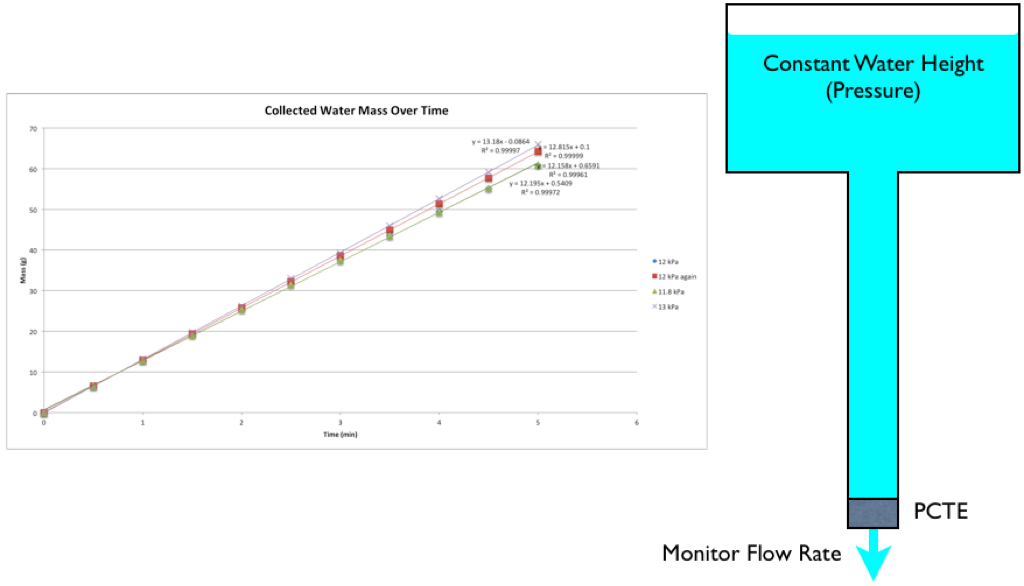
The mass of water collected increased in an almost perfectly linear fashion as a function of time each time. This is good, because the flow rate through the membrane should be constant for a given pressure.
Experimental Results
Under a driving pressure of 12 kPa, the average flow rate was measured to be 12.8 mL/min with a standard deviation of 0.1 mL/min (shown in the figure below). Using the same theory from before as well as values and error bounds taken from the membrane supplier, the theoretical flow rate was also calculated.
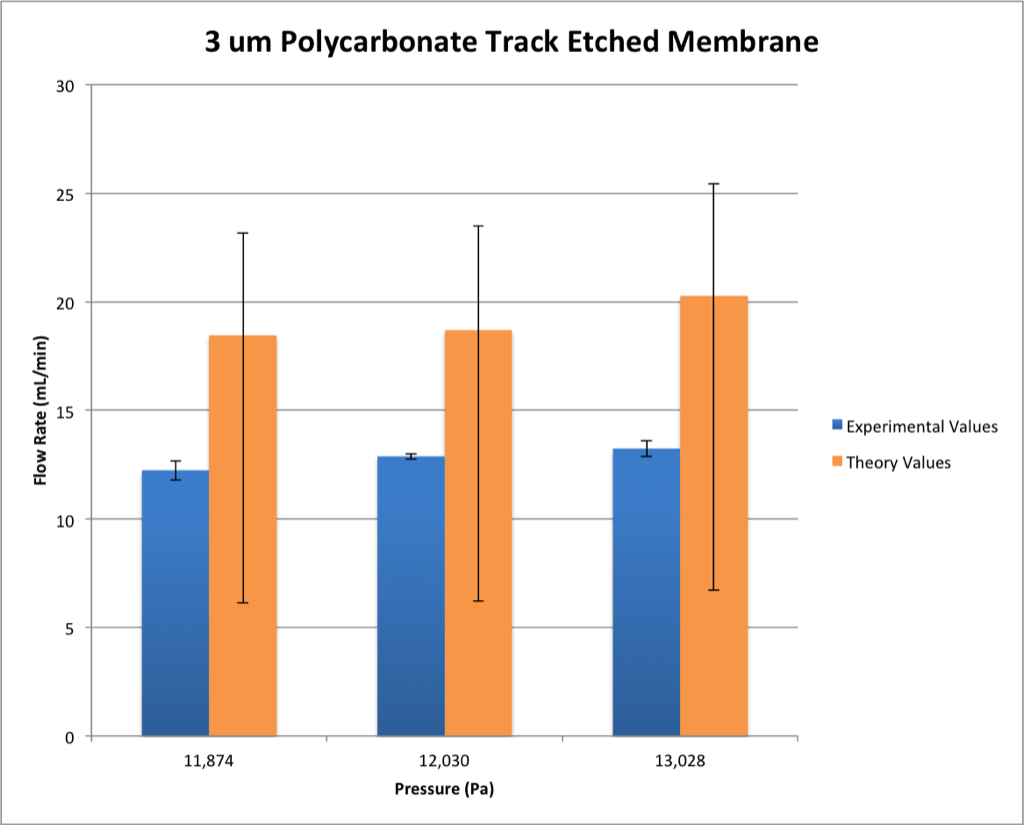
As can be seen, the experimental values fall within the theoretical predicted range. The reason the lower error bar in theory is so low is that flow rate depends on pore radius to the fourth power. The supplier claims that while none of the pores are bigger than 3 microns, they can be up to 20% smaller (which gives rise to the wide prediction range).
Conclusion
These values give an average permeability of 1652 cc/cm^2*min*bar with a standard deviation of 42 cc/cm^2*min*bar. This means that a membrane 75 times thicker and half as porous as the silicon nitride is almost 20 times less permeable.
Further Investigation
It would be worth repeating these trials with other PCTE membranes to establish whether they consistently perform below average theory levels (which could indicate that the holes tend to be smaller than the supplier rates them). It would also be worth running a control system to assess the frictional effects on membrane performance (since the device used in this trial was different than that for the SiN membranes).