Effect of Active Area on Electroosmosis
Does more active area mean more fluid transported by electroosmosis?
To test this I found an ancient wafer (w13) that had different active area geometries. Can someone check and make sure I got these right:
- Long slit – .1 x 1mm
- Short slit – .1 x .5mm
- Point – .1 x .1mm
- 3×3 Point Array – 9 .1 x.1mm points
- Double slit – 2 x .1 x 2mm — current geometry
I tested each of these in PBS and measured the amount of buffer transferred. All samples were oxidized. Here are the results with trendlines (all trendlines forced through origin):

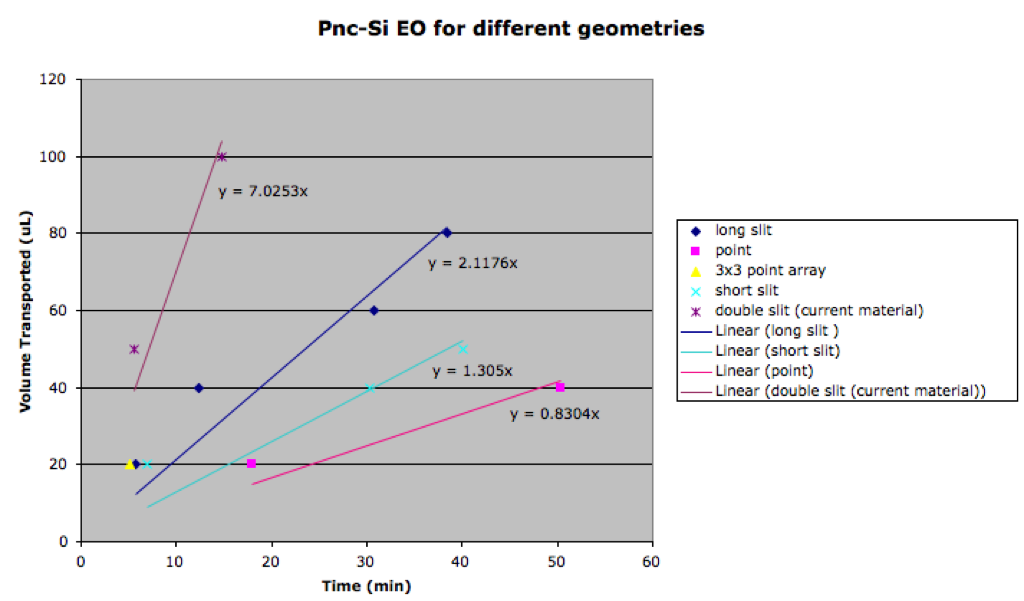
Note: Point array only has one data point because the system leaked after this.
This looks reasonable. As active area increases, so does rate of EO. I took this data and plotted the active area vs. rate of EO:
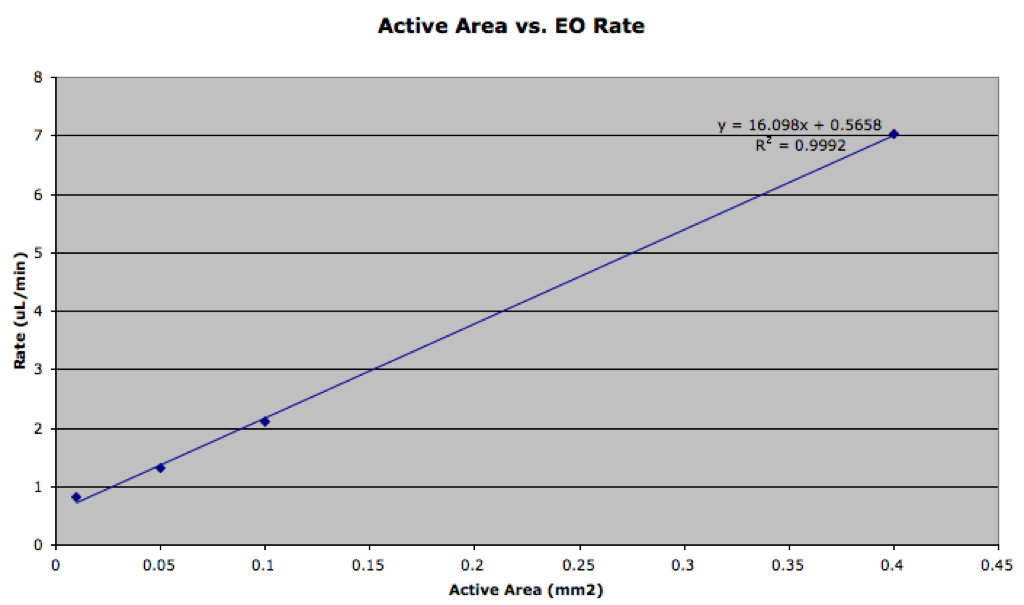
Looks pretty linear.
w13 had animal cracker pores, with some nearing 50nm. Pictures
Awesome!
First.
Very good. Makes sense and is in-line with what we were thinking. This would appear to extend to porosity as well, since larger active area and higher porosity should be equivalent – so you probably need to be careful with in-wafer porosity variation.
It also means we can make a direct comparison to the flow rate through the PES and cellulose, normalized directly to area. The sizes that you gave look correct, but someone should measure them on Brian’s scope, or whatever scope you like best. With brian’s there is a reference slide with 100 micron lines that can be imaged and used to generate a scale bar. We may have targeted those sizes, but there are so many other effects that can change the actual final size..
Very cool – as long as this is in the linear range, anything we do to increase voltage across the memebrane will also increase flow. We likely have a lot of linear range left – if we can figure out how to apply voltage closer to the membrane w/o covering it with bubbles….
Oddly, the two figures look the same in the post, different when you click on them.