Membrane deflection can be characterized using the Veeco Wyco Optical Profiler
An initial experiment for membrane deflection characterization using an optical profiler (Veeco Wyco) has been performed.
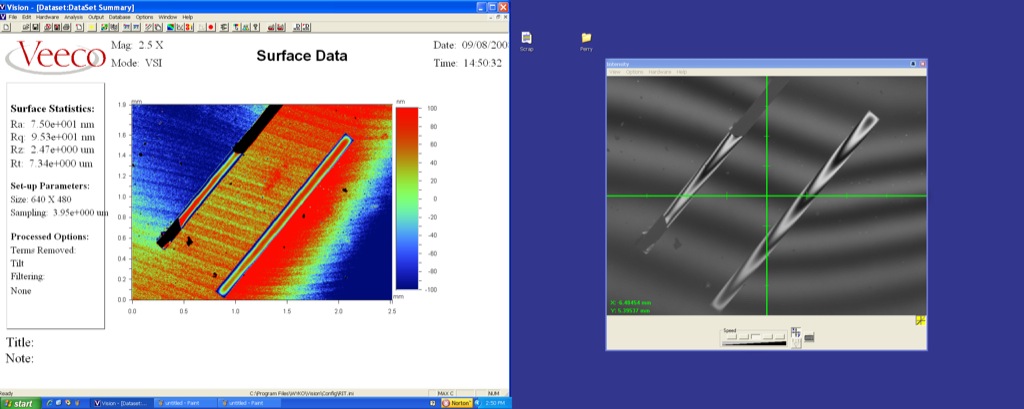
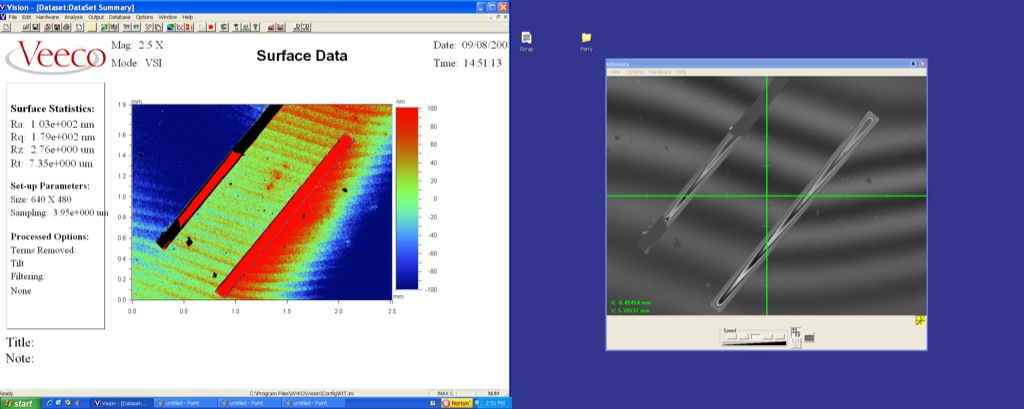
Below are some of the images taken with the tool: (a image was taken at each 0.5 psi interval):

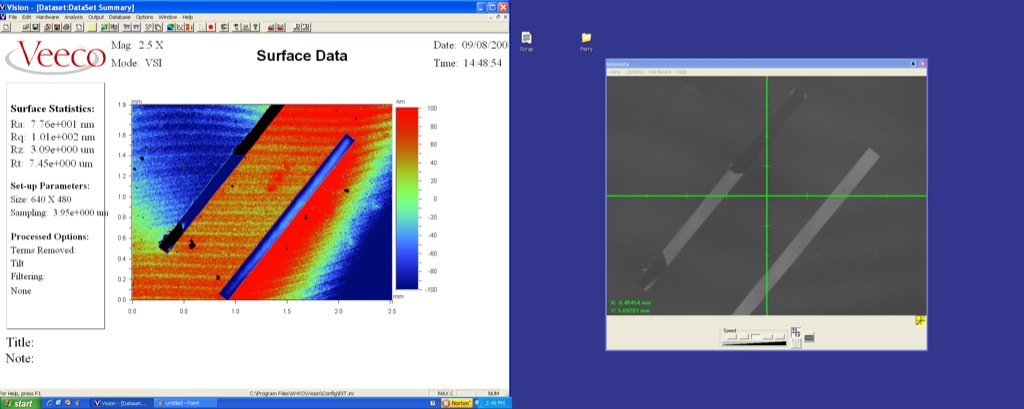

Once we get a pressure regulator we will be able to generate numerical data of membrane strength/deflection down to 5.0 nm vertical resolution for a given pressure. This tool will also allow us to perform 3D animations of the membrane deflection due to a varied applied pressure (among other things). More importantly, the Wyco will provide an exact “burst pressure” for each membrane that is tested.
What does the left hand window and right hand window show us? I see some “waves” on the silicon support… is this just noise or are those real deflections?
It seems like this tool might be able to do some of the things we were thinking about for AFM. How long did it take you to get these pictures, JP?
The image on the right is more important for alignment than for data. It is a plane-wave interferometer image, similar to what is used to spec optics. In this context, it is a measure of how perpendicular the sample is to the tool – the more perpendicular, the better, i.e. fewer “waves”. Interestingly, you can see the deformation of our wafer support quite clearly in these images – probably not a huge issue, but something to keep in mind.
Once aligned, these images are likely taken in a few seconds, but JP can give the details.
In these images, the differential pressure is likely lower than expected, since one membrane is broken. In the next experiment, the z-range will also need to be expanded to catch the larger membrane deflections. This looks very promising on a variety of fronts…
I was going to give the details at the meeting but didn’t get the post out in time.
As Chris explained, the right image is only relevant as a calibration verification mechanism. Ideally, the image should have a minimum of 2 diffraction orders and a maximum of 4 for optimal results. It is also good to have the diffraction orders run exactly parallel or perpendicular to the feature of interest (in or case, the membrane slits), although this is very difficult sometimes and not required.
The calibration is actually the most time consuming stage of the measurement (~20 min.), although once it has been established, subsequent measurements can be made with ease. After initial calibration, measurements take about 30 seconds each.
The left image is what is important. As you can see from the color scale on the right, the tool has good resolution and, in the first image, the torn membrane is ripped so there is a slight “lag”.
I am spending time now learning about the software. It is very involved and has quite a few functions. I mentioned the 3D option where the membranes image can actually be rotated in 3D space. The tool also has a strobe which allows for frame/millisecond animations. There are also very detailed numeric calculations for several parameters. In the above images, I have shown both the surface data (surface roughness, ect.) and step height. There are also ways to determine deflection, elasticity, etc. not shown here.
We also have the ability to change objective lens to get higher magnification on membrane edges.
And it does appear that the wafer support is deforming based on these images.