Confocal Analysis of Apical and Basal ICAM-1 Expression Following Polarized Cytokine Delivery
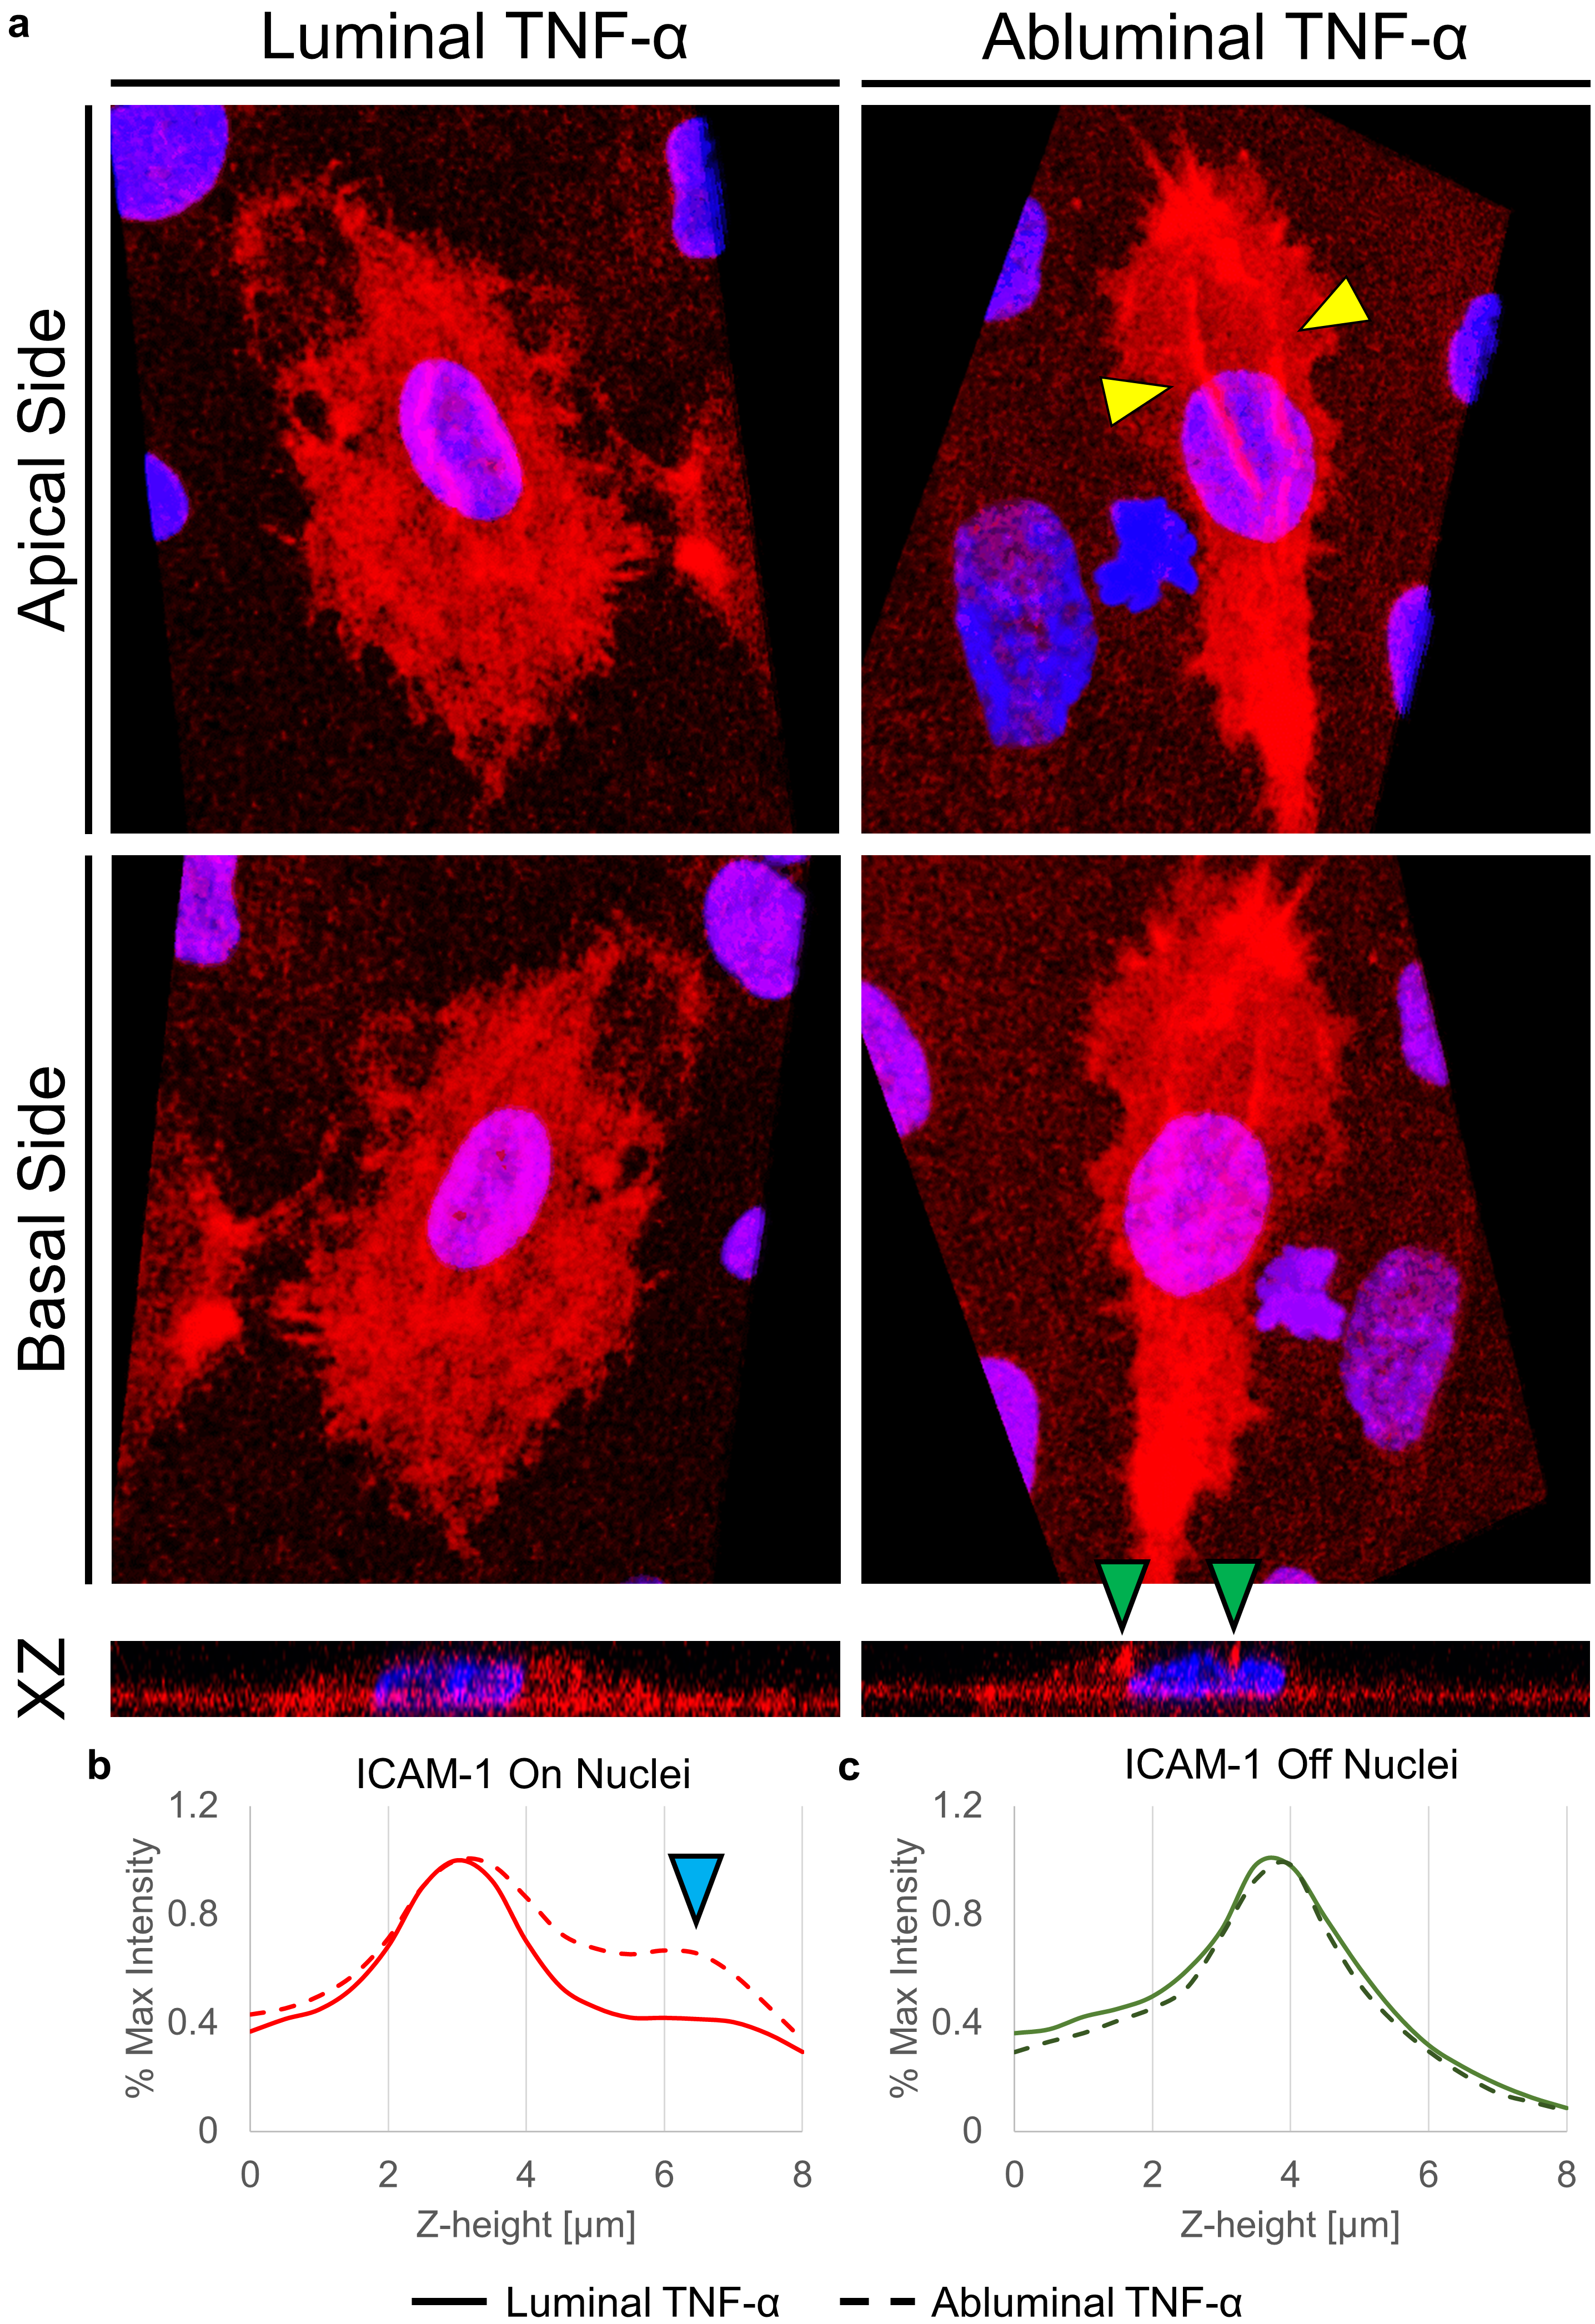
My last cell post involved pictures of HUVECs after 1 day of growth on commercial transwells and pnc-Si Sepcons. Over the past week, I’ve been growing HUVEC on commercial PC transwells and pnc-Si in the Sepcon format in order to track the TEER. To get more data out of these cells, I decided to do…
It’s been a while since I’ve done long-term BBB co-culture experiments on transwells but I recently completed a study. I was particularly interested to determine whether I could reproduce this spike in TEER that I measured in 1 previous experiment. I also needed repeats anyway. I followed the normal procedure – seeded P11 bEnd3 on…
In this post, I sum up all the NSN stacks with different Si thicknesses I have made so far. The nitride layer is 30nm thick for both the top and the bottom. The thickness for silicon film ranges from 7nm to 10nm, 15nm, 25nm, 50nm and 100nm. All the wafers were firstly etched and then…
After reading and discussing a paper in journal club that talked about cells having a “mechanical memory” (found here “Mechanical memory and dosing influence stem cell fate“), we decided to replicate our previous YAP/TAZ experiments with passage one HUVECs direct from Life Technologies as to avoid making our cells “remember” that they had ever been plated…
A couple weeks ago, I showed some preliminary data on H2O2 detection via the Amplex Red Assay, which is a project for one of our high school students. This generated some discussion at the last NRG meeting about diffusion through “nonporous” membranes. Jess wanted to look at very small molecule diffusion in her set-up so…
A few weeks ago, I posted some high resolution (100X) images of BBB co-cultures stained with 3 different colors. I also included the z-height of the different focal planes of cells on either side of PET transwells. In this post, I present a repeat of this experiment, along with the same analysis performed with cells…