Cell-cell separation in co-cultures
A few weeks ago, I posted some high resolution (100X) images of BBB co-cultures stained with 3 different colors. I also included the z-height of the different focal planes of cells on either side of PET transwells. In this post, I present a repeat of this experiment, along with the same analysis performed with cells on pnc-Si transwells.
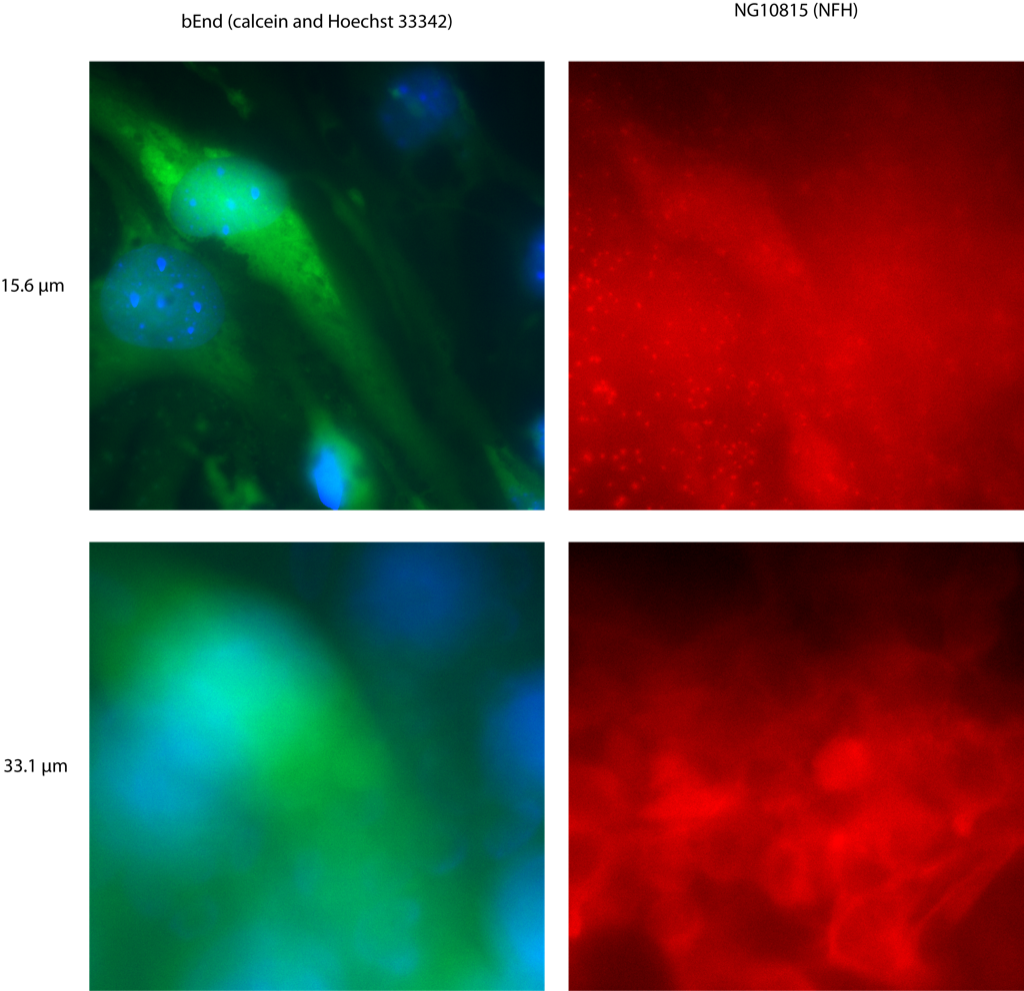
These are BBB co-cultures, with the bEnd3 cells stained green with calcein-AM and their nuclei stained blue with Hoechst 33342. The glial cells on the opposite side of the membranes were stained red with a neurofilament-H antibody. I used mounting media to slow down photobleaching during imaging at 100X. A nice feature of the Zeiss is that you can see the z-height of your focal plane, which is convenient to track the distance separating cells in z.
This 1st image shows a repeat on PET. At 15.6μm, green and blue fluorescence is bright and crisp but red fluorescence is blurred. This is the focal plane of the bEnd3 cells. At 33.1μm, the green and blue fluorescence is out of focus but cell outlines and extensions are in focus in the red channel. This is the focal plane of the glial cells. Based on the z measurements, these cell types are separated by 17.5μm.
This image shows blue/green, red and DIC channels for the BBB co-culture on pnc-Si. The left 2 columns are 1 sample at 2 different focal planes and the right 2 columns are a different sample at 2 different focal planes. At 28.1μm (the bEnd3 cell focal plane), blue nuclei are in focus and some vacuoles in the bEnd3 cells are visible. There is significant red fluorescence that seems to co-localize with some of the green fluorescence – I think there is bleed-through with these fluorophores, for some reason. Both cell types are visible in DIC. At 21.8μm (the glial cell focal plane), the green and blue fluorescence is blurry but the red fluorescence seems specific for glial cells. In DIC, the glial cells are clearly in focus, as well. In the other sample, at 18.2μm (the glial cell focal plane), the green and blue fluorescence is blurry but glial cells and their extensions are clearly visible in the red channel. Glial cells look good in DIC, as well. At 28.1μm (the bEnd3 focal plane), green and blue fluorescence is in focus and there is bleed-through into the red channel again. In DIC, the bEnd3 cells and their vacuoles are clearly in focus. For this experiment, the focal planes were separated by 6.3μm and 9.9μm.

I was disappointed with the red/green overlap in the previous set of images so I repeated the experiment with a different sample. Here, at 47.3μm, green bEnd3 cells were in focus. The red fluorescence was blurry in the background (bleed-through from the green bEnd3) but a little brighter in the middle where glial cells were present (on the other side of the bEnd3 cells). At 39.7μm, green fluorescence is totally out of focus, and red glial cells are in focus with very little background. For this experiment, the focal planes were separated by 7.4μm.
Both cell types are more in focus at the different focal planes for pnc-Si than for PET because there is less z-distance separating the cells. Therefore, it is more likely to capture fluorescence from the opposite side of the transwell membrane when looking at 1 cell type on pnc-Si than on PET.

So, for 4 different pnc-Si samples, I calculated the cell-cell separation to be 8.3 +/- 1.9 μm (average +/- SD). For 3 different PET samples, I calculated the cell-cell separation at 17.2 +/- 0.462 μm. Not surprisingly, these distances are different by ~ 10μm – the thickness of the PET membrane. Cells are separated by ~ 2 cell diameters on pnc-Si but by ~ 2 cells diameters+10μm on PET.