Water Permeability and Pore Comparisons
Previous Post on Water Permeability Figure
We decided at the last meeting to show water permeability for each membrane used rather than plot for a specific characteristic like porosity. I did this but there were a few samples that still had a noticeable deviation between experimental and calculated permeabilities. I asked Dave to reprocess the images, and I calculated new results based on this reprocessing. Here’s a comparison of the two figures:
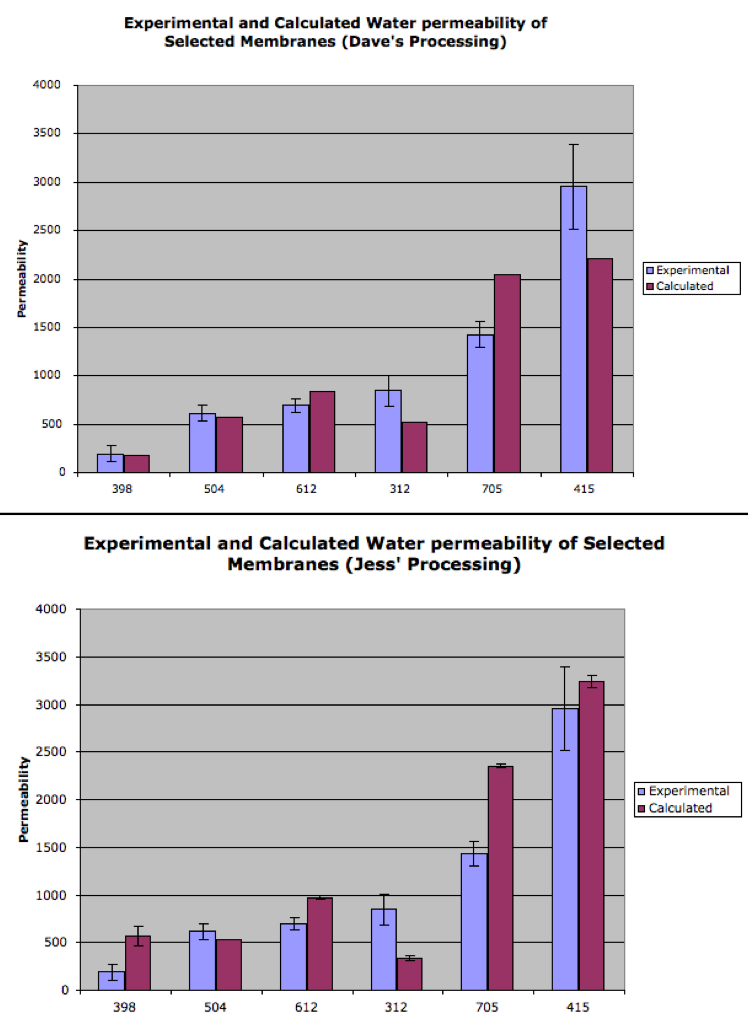
Dave’s reprocessing brings 398, 504, and 612 closer. It also improves 312 and 705, but there is still a deviation for these two. Dave’s reprocessing makes 415 look worse.
A couple of weeks ago I was trying to find an agreed upon method, although it seems that Dave’s method is better than mine in most cases for this specific example. However, as I understand it, Dave’s method is more subjective than mine. This might make it difficult for different people to produce similar statistics. I think this also shows there’s a lot of wiggle room for these calculations. Any thoughts?