Size separation of DNA with NPN pre-filters
Since my last update I have been trying to achieve reliable size-separation of DNA by length using dwell time with the NPN pre-filter. Originally I had hoped to achieve 250-bp resolution near the optimal length for the NPN filter devices that we are working with, but that turned out to be a bit overly ambitious, so I have been working on 500-bp separation using 500, 1000, and 1500-bp dsDNA.
The last few chips with nitride caps yielded poor results. They were very unstable, and rarely lasted long enough to get both the mixture and controls of each molecule alone on the same pore. The mixture results I got were all over the place, and generally confusing. Because I was unable to get both controls and mixture experiments done, it’s hard to comment much on those experiments. So I moved on to the devices without SiN caps and things improved immediately.
The essential difference between the capped and uncapped chips is the size of the oxide holes, which are bigger in the uncapped version. This could lead to more bowing of the NPN than usual and change the effective gap height slightly from the capped versions. However, because these chips are used in a liquid environment and are mounted vertically during sensing there should be no gravitational force affecting the NPN and so on average the gap height should not change much. In support of this, the results I have been obtaining on the uncapped chips fit the trends from before, so I am comfortable at this point comparing results directly between the two. That’s the first bit of good news.
The second piece of good news is that the uncapped chips are much more stable than the capped ones, showing improved performance and with one exception lasting long enough to get results with the mixture, and all three molecules individually, with minimal (but still nonzero) pore growth in between. The results for the mixtures with the filter in place are below:
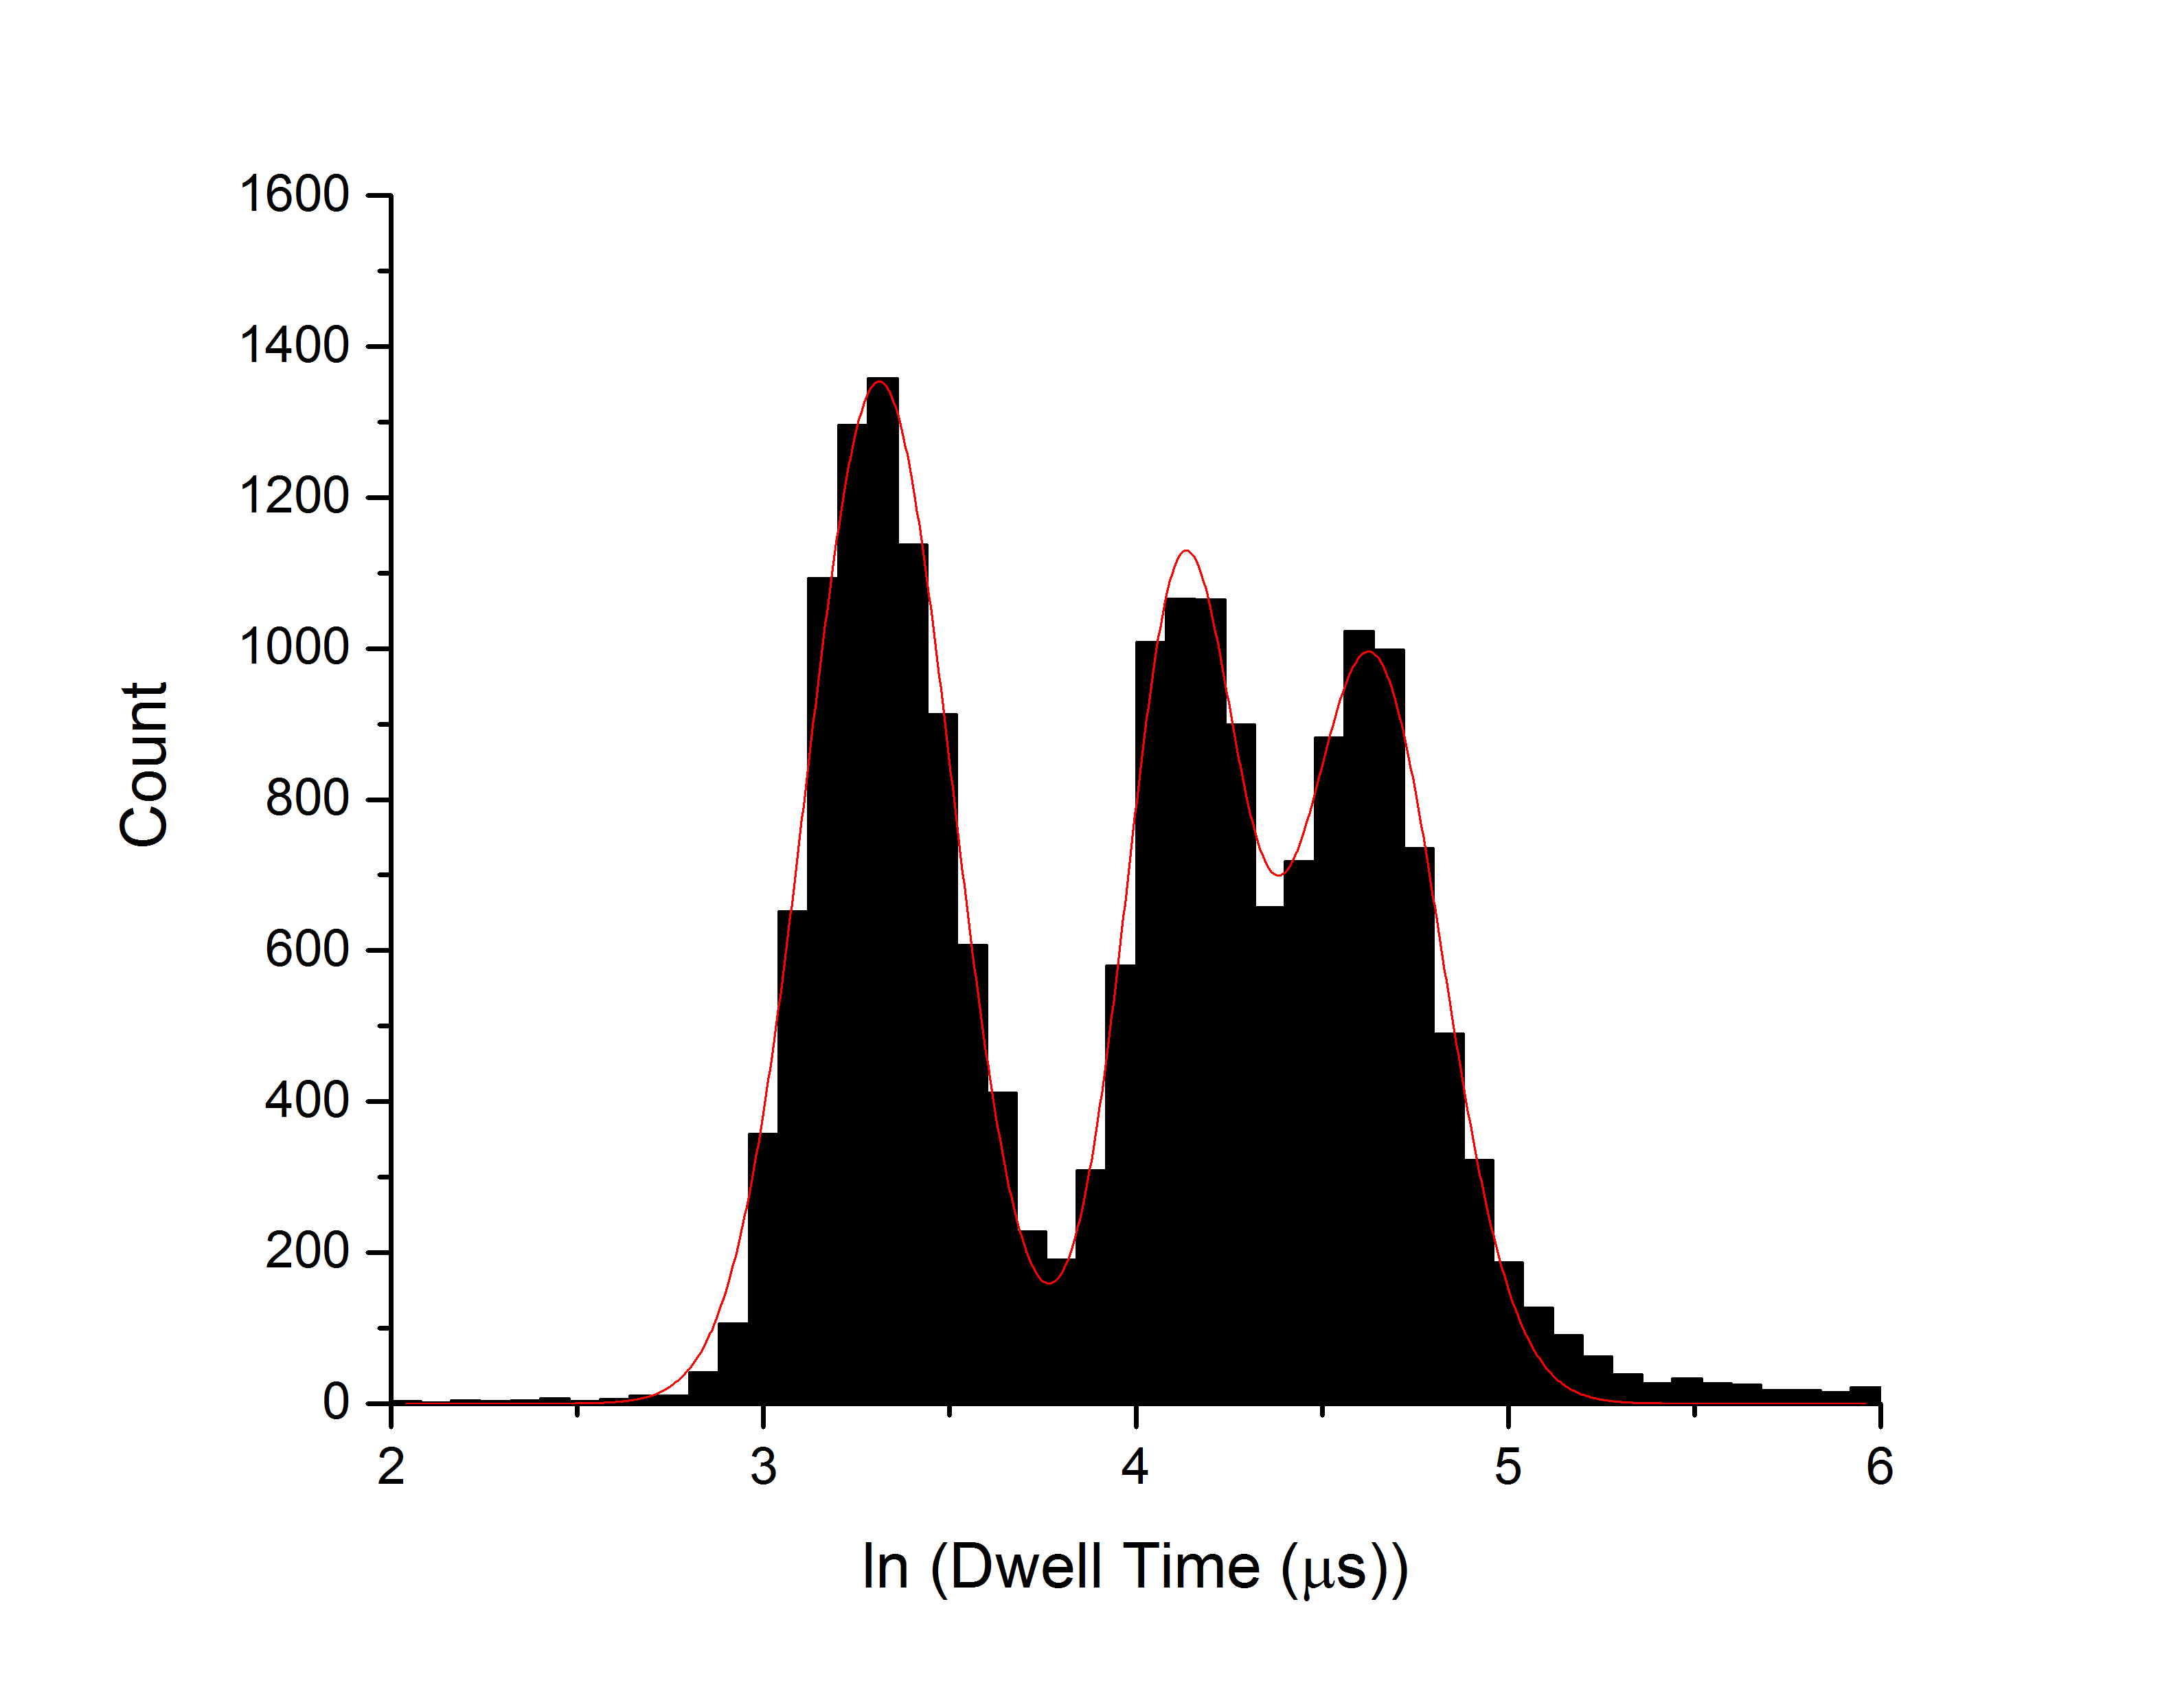
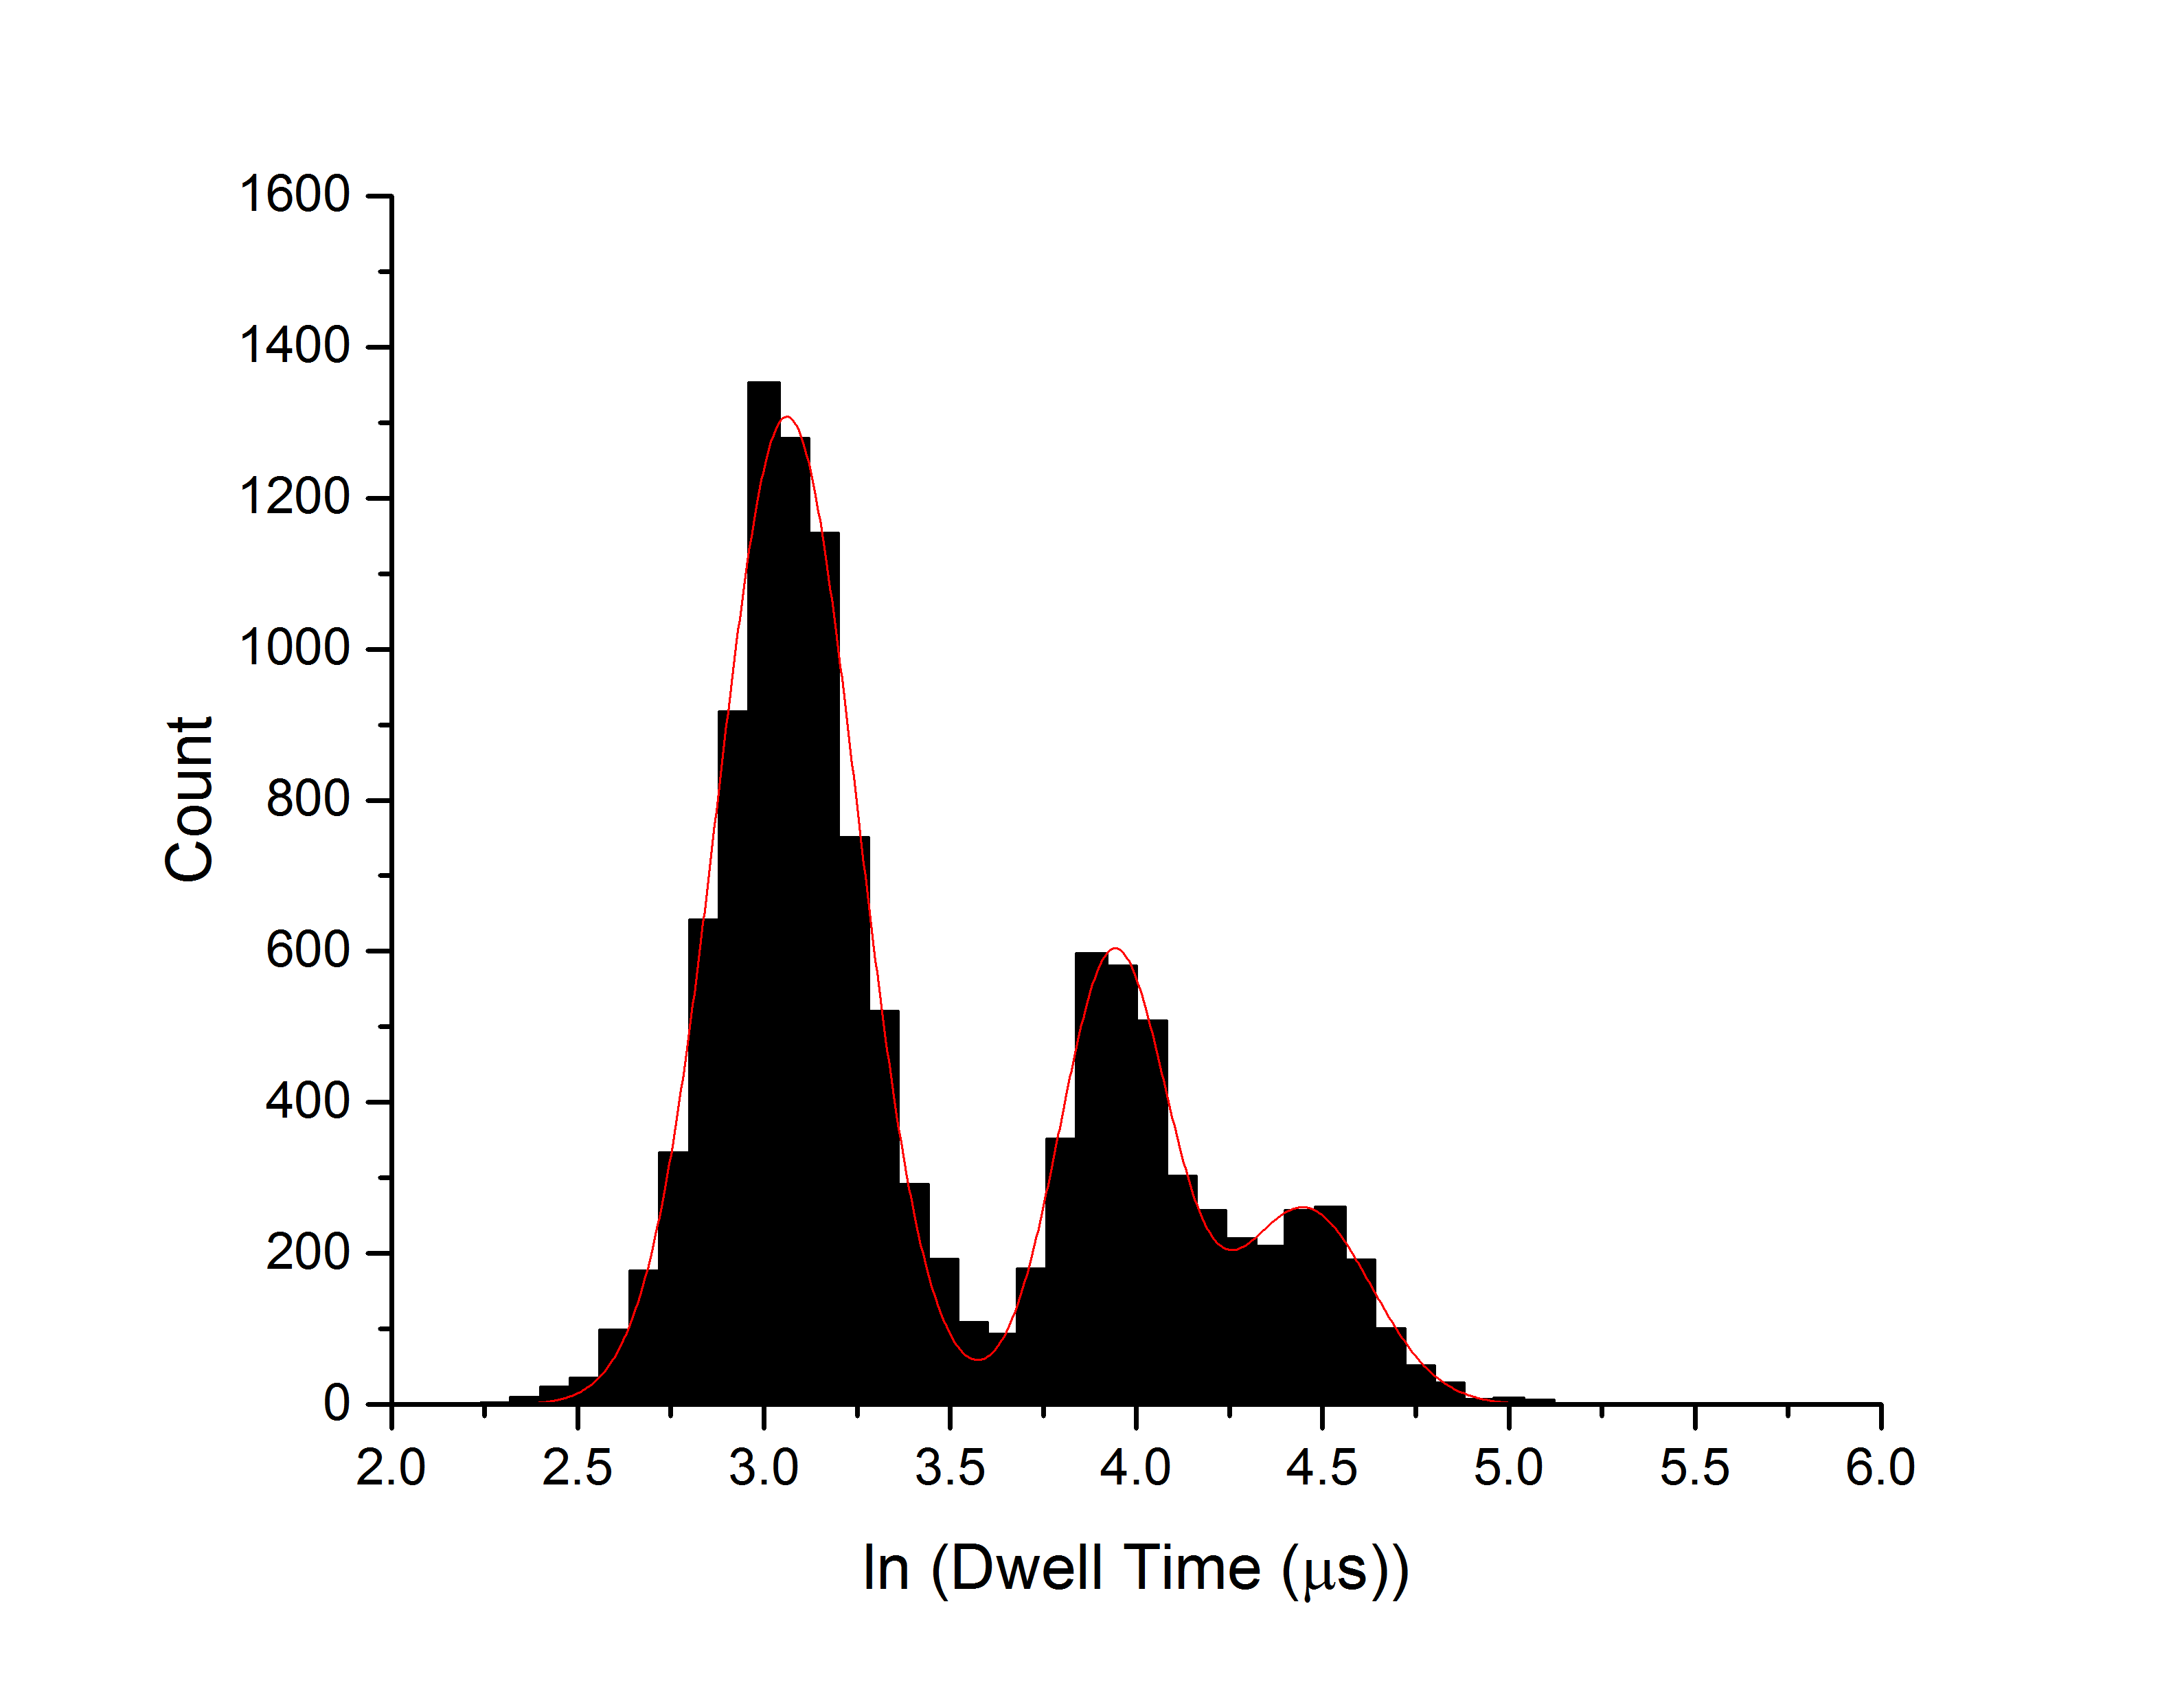
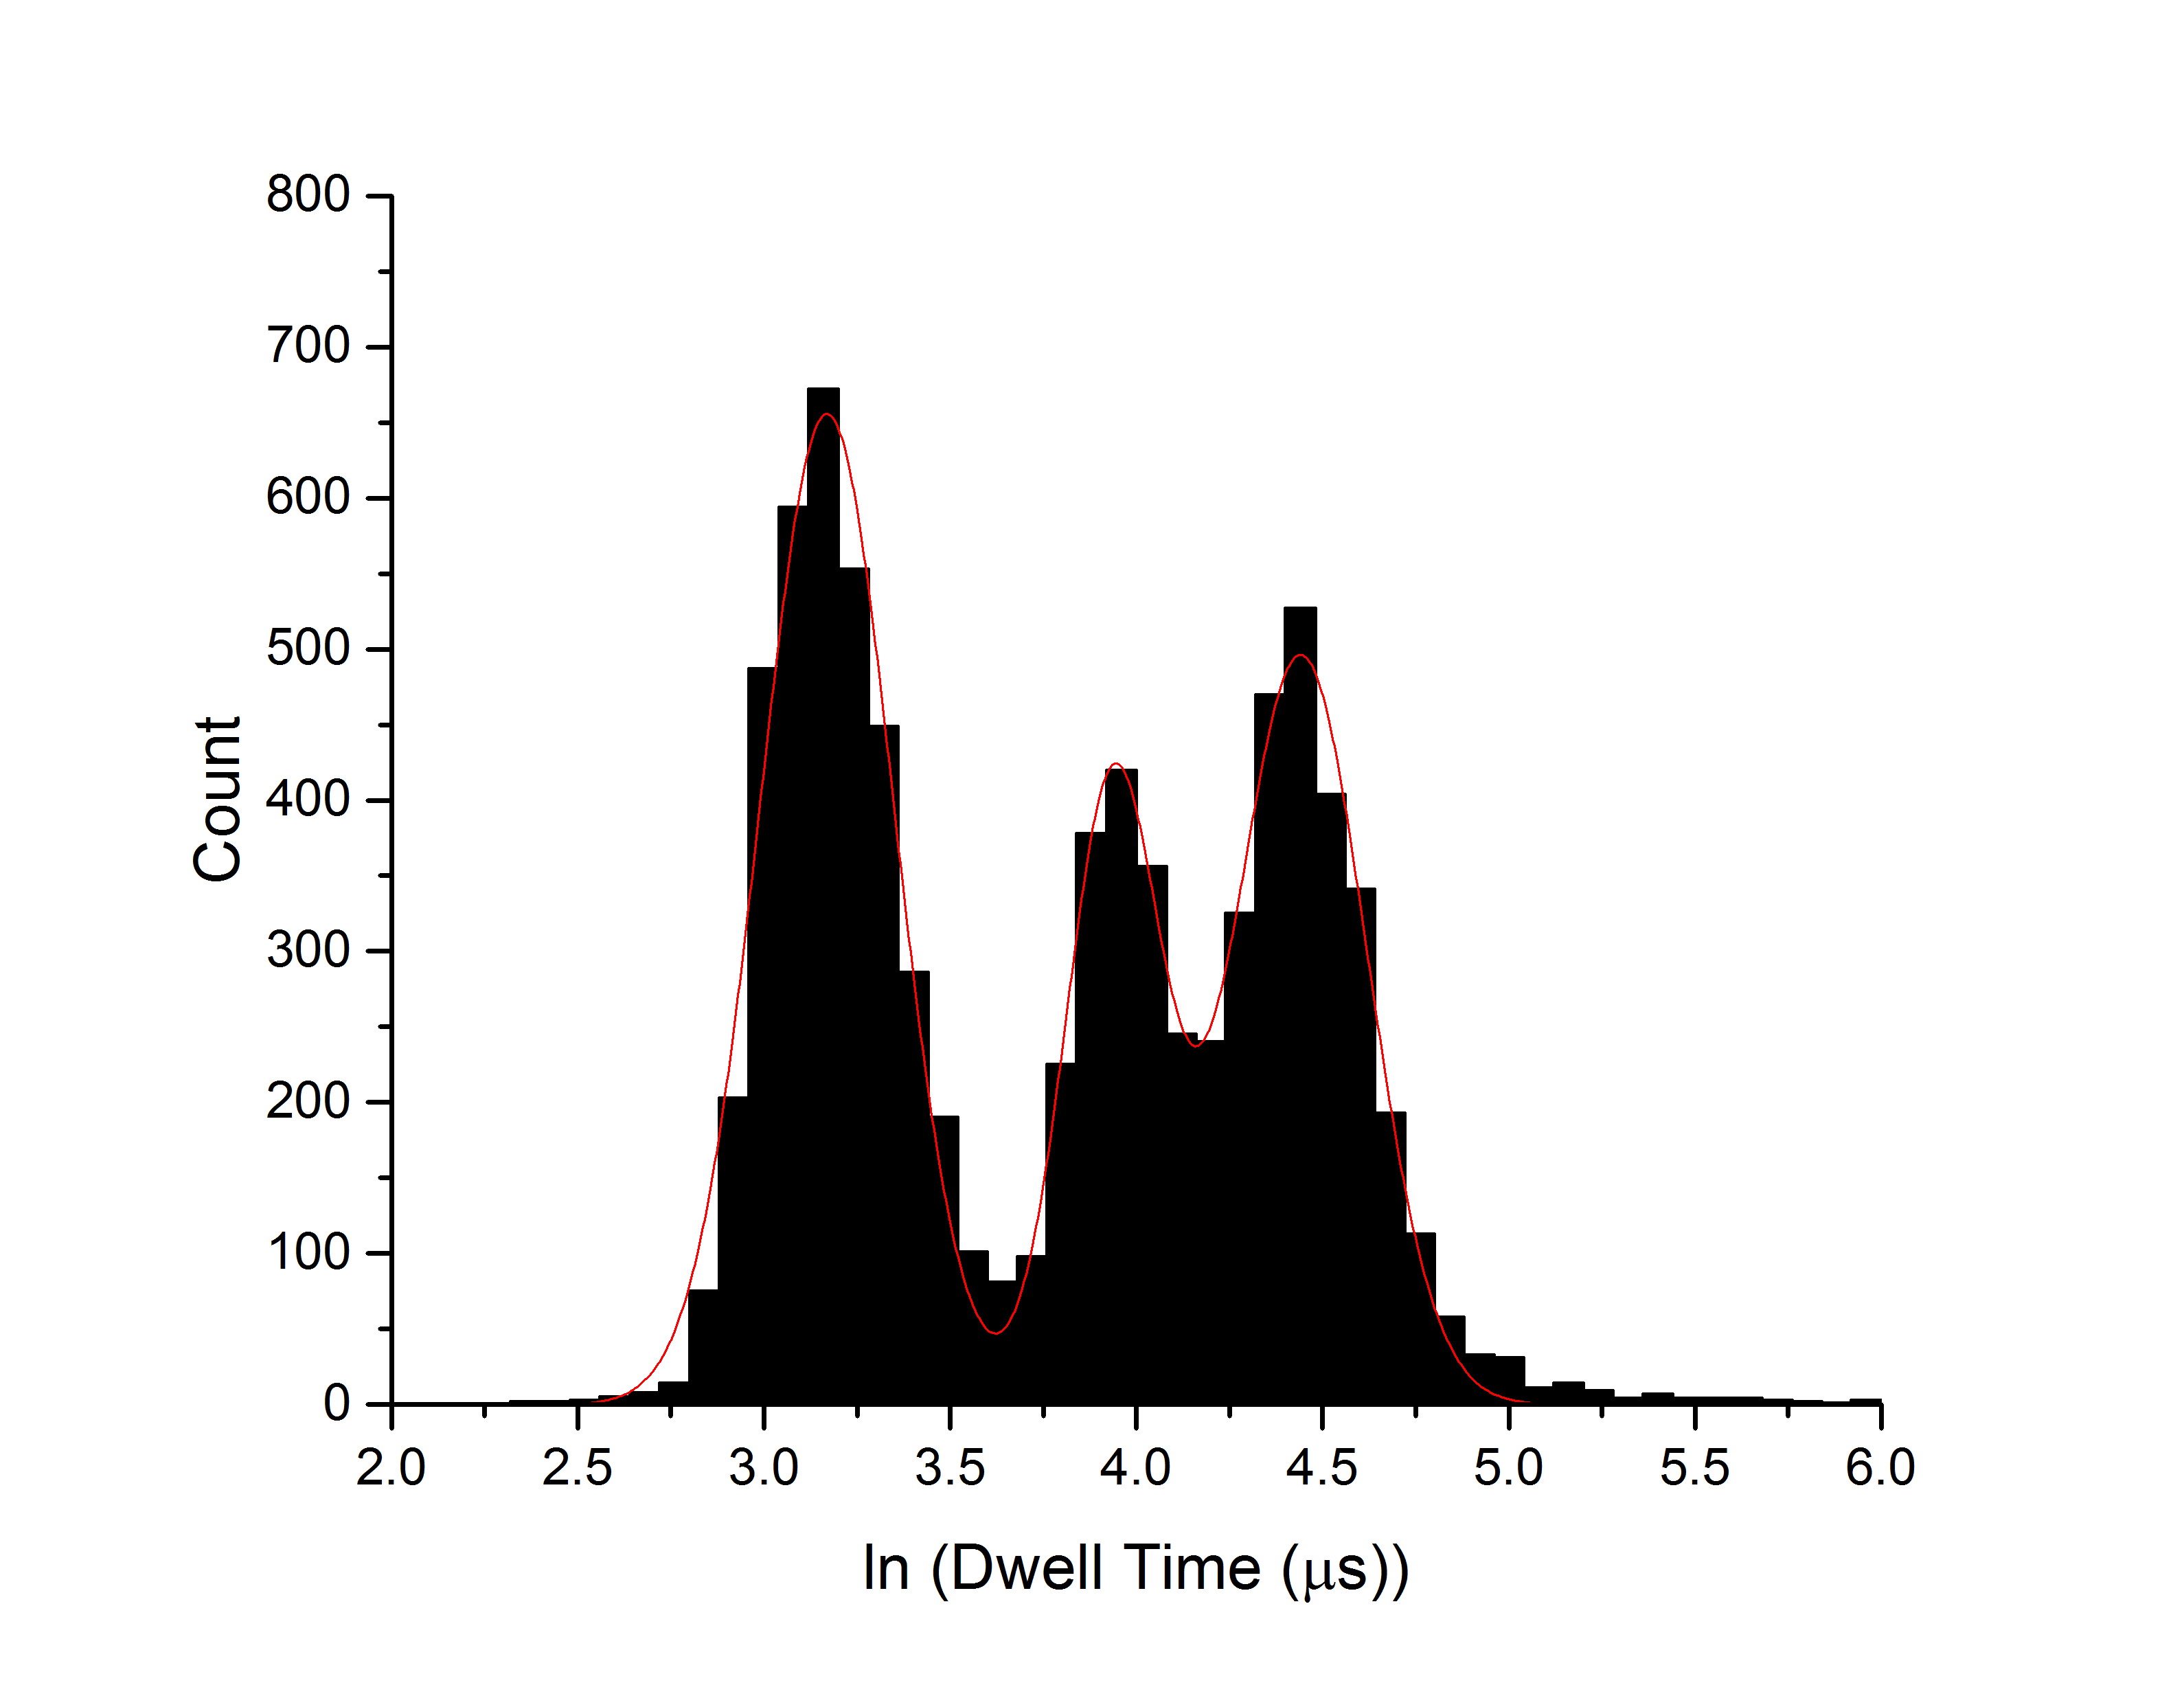
Each one of the figures above shows a different pore with a mixture of 14.5nM each 500, 1000, and 1500bp dsDNA. The results are post-filtered to only include single-file, unfolded passage. Clearly, we can separate molecules by size using dwell time with the filters, and we have about 500-bp resolution in this range (since mean dwell time and standard deviation both grow with length of molecule, resolution will get worse with length). Two of the three experiments above also have accompanying controls where each size is run alone in the pore, with the third one being too unstable to get all 4 experiments done before it was out of range for my amplifier.
Controls without the filter also show that you can recognize the presence of all three molecules most of the time, but the peak width is larger and the resolution poorer:
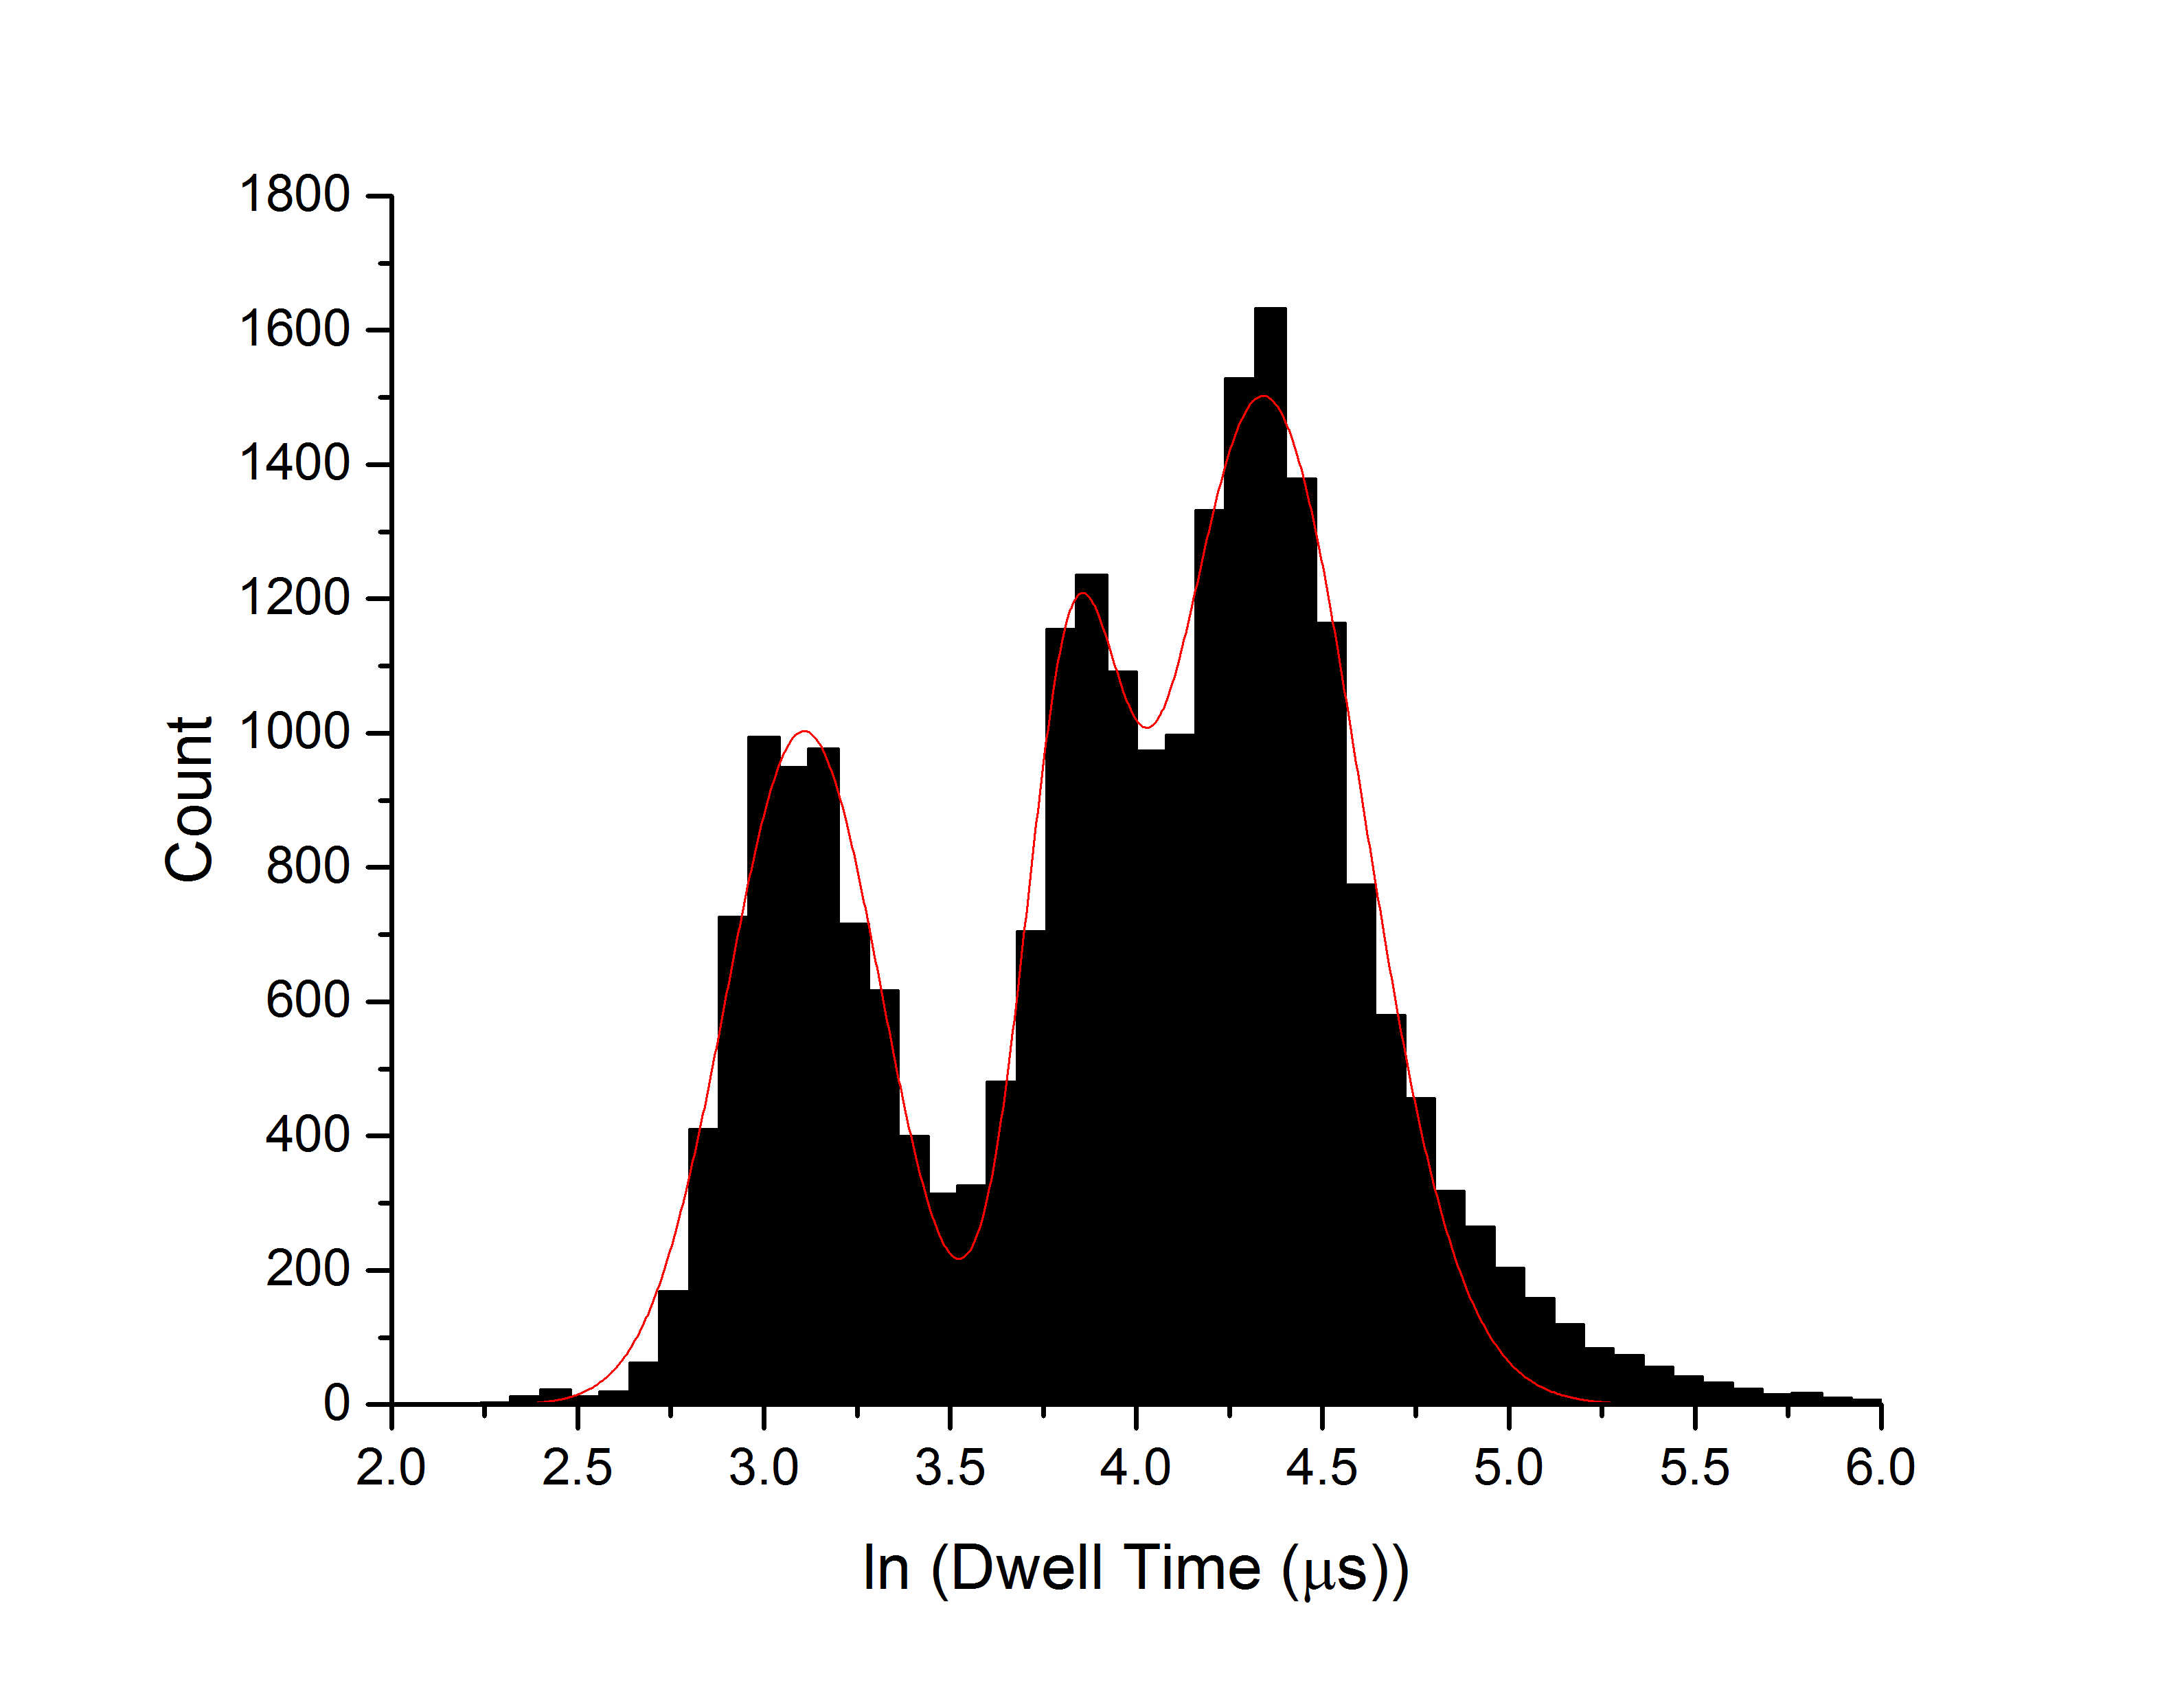
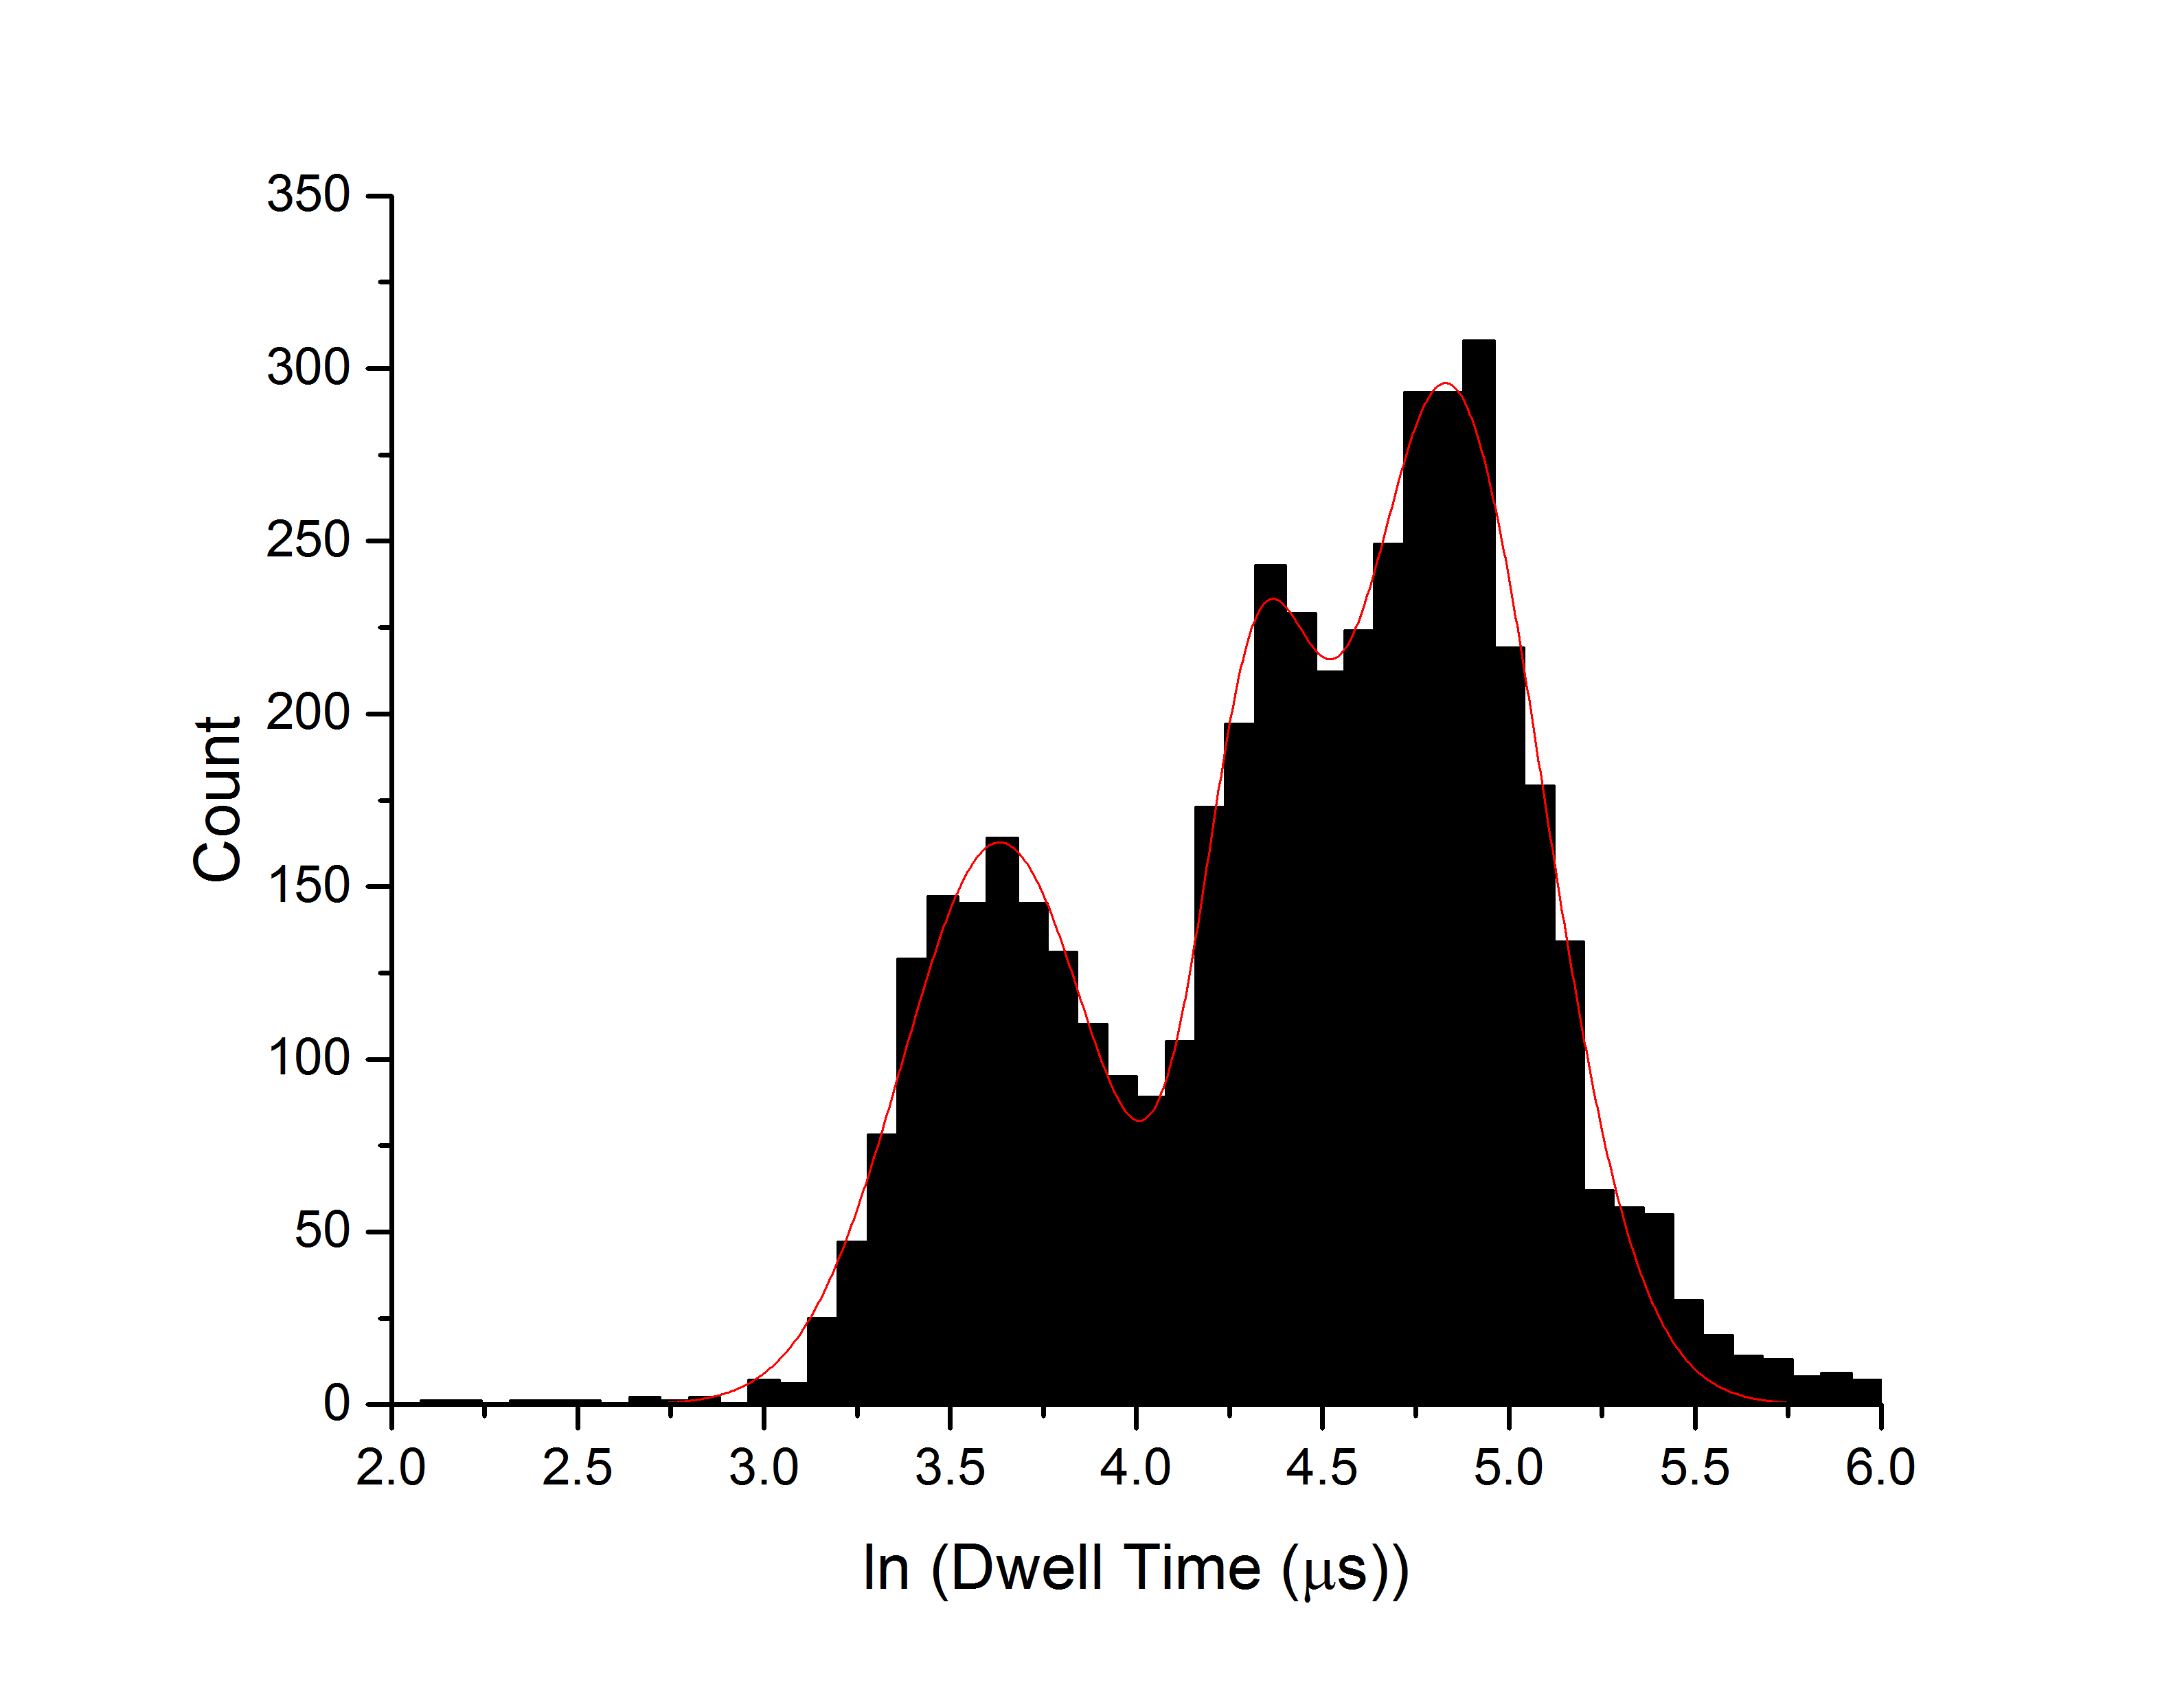
There are a few features of note here. One is that for a regular nanopore, we expect exponential scaling of capture rate with molecule length for this range of DNA size. Since we are working with equipmolar concentration of each species, this would translate to an exponentially increasing peak height as a function of length. However, we see decreasing peak height with size when the filter is in place. This is direct experimental evidence that the filter is actually there (not that this is surprising given results from previous blogs, but it’s nice to be absolutely certain). Note that the comparison here isn’t perfect since I am filtering out all of the folded translocations, and in principle that could change the relative peak heights since folding probability will also be length-dependent and should preferentially select for shorter molecules, but since the controls show the increased capture rate with molecular length that we expect for un-shielded pores I think it’s a safe comment.
The peaks width (the standard deviation of the log-transformed dwell times) is larger when there is no filter present:
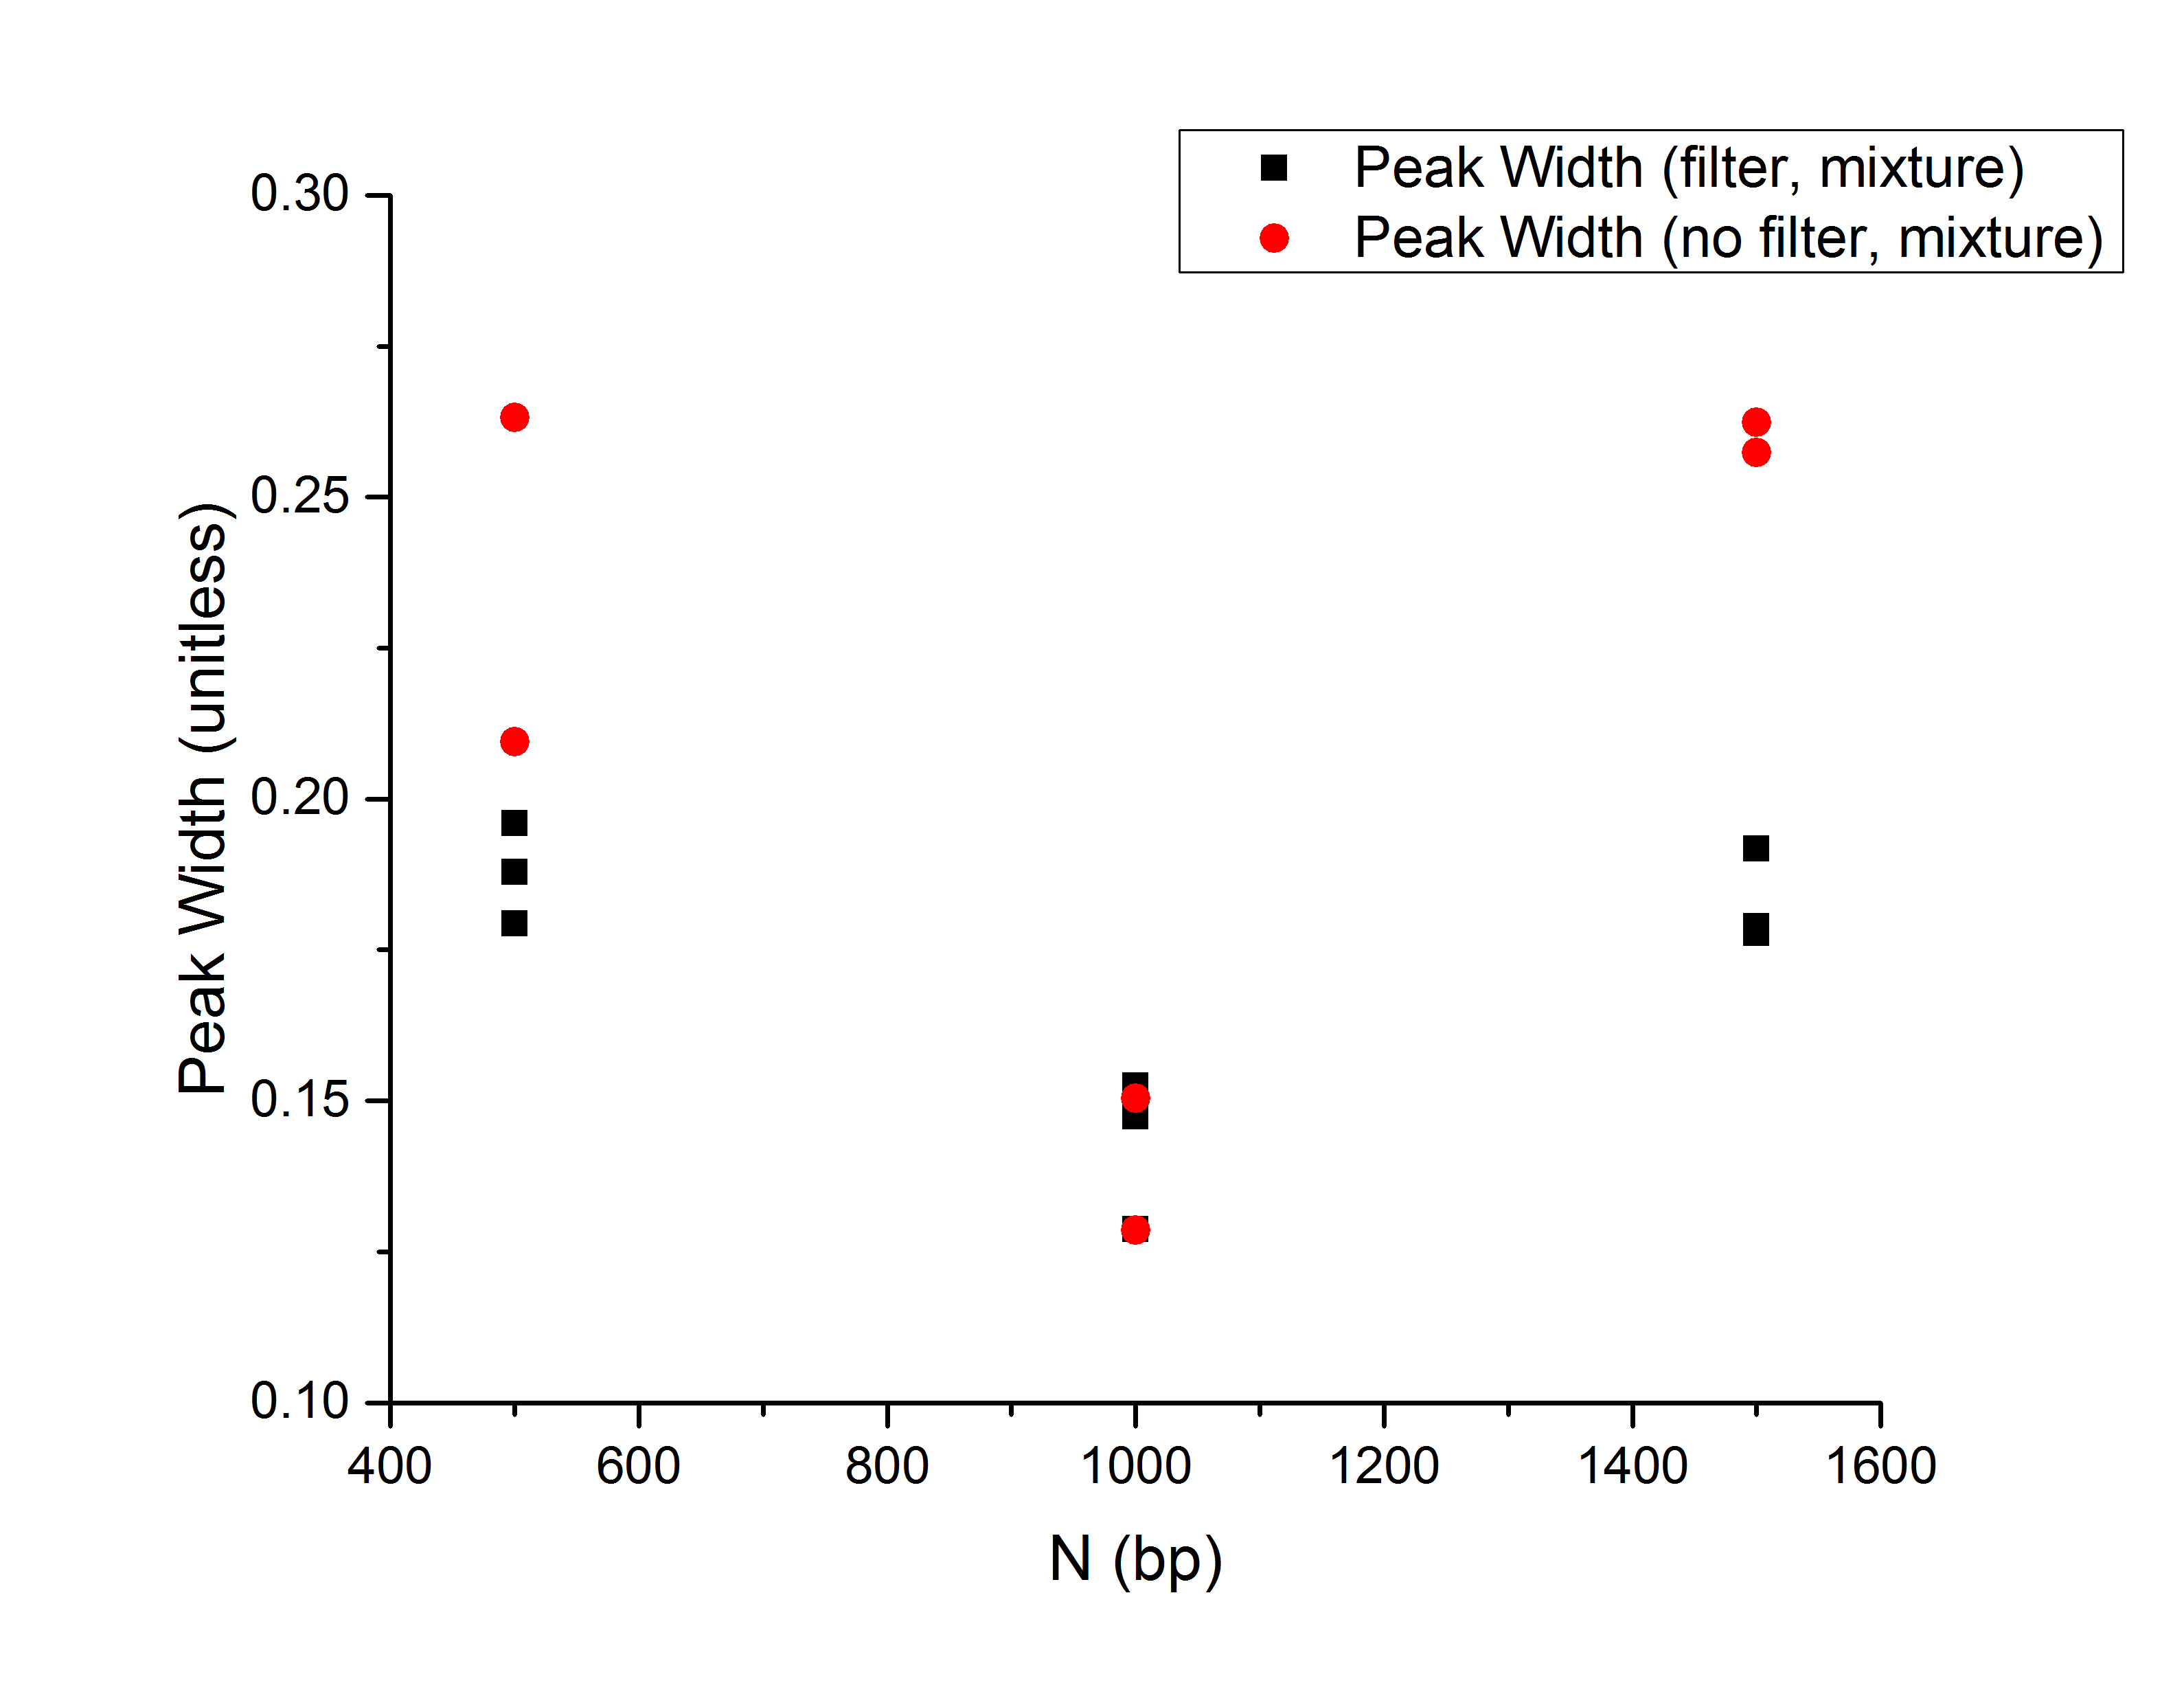
This is expected based on our previous findings, though the results at 1000-bp are a little off-trend. There are only two of each experiment there, so it could be back luck, since I’ve noted previously that unfiltered pores can occasionally match filtered pores for performance.
Something intriguing that has come of these experiments is that I’ve noticed that the width of the peaks is systematically larger when there is a mixture of molecules in the pore compared to when there is only a single species:
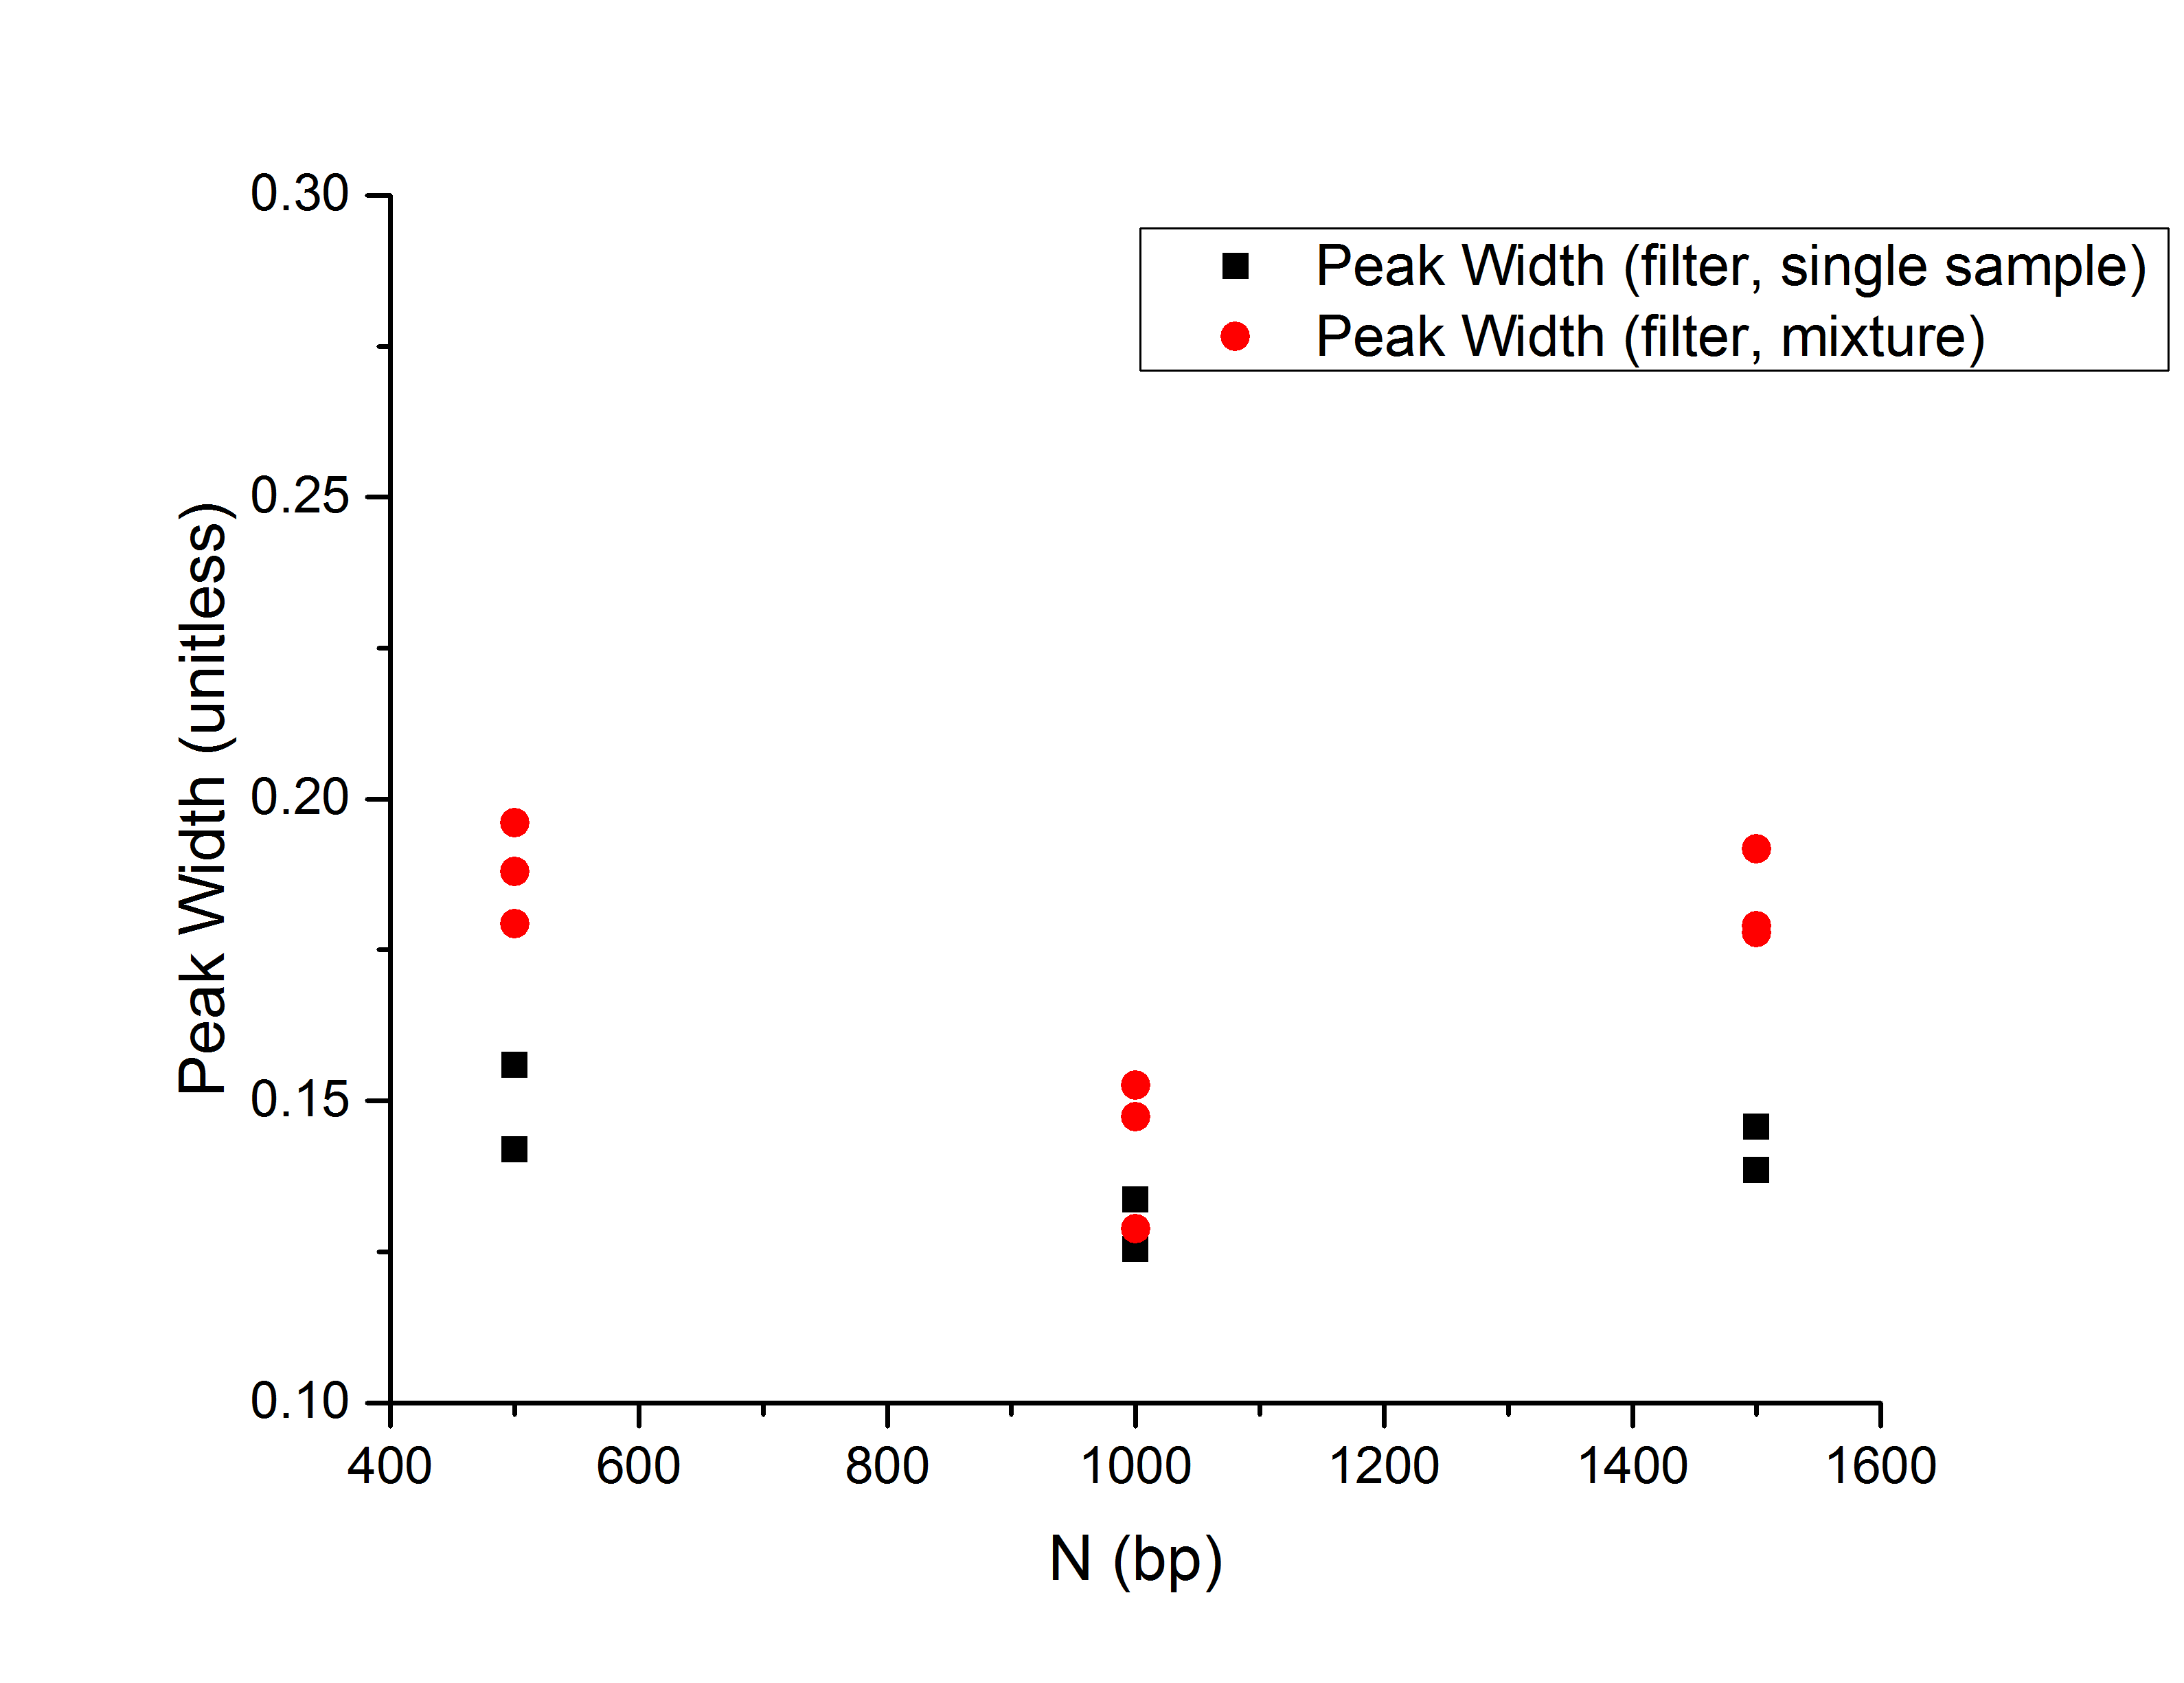
This is a rather counter intuitive effect that I’ve mentioned before. As noted in the comments on a previous post, mixtures of different sized particles may not behave as a linear superposition of the constituent parts. However, the time between translocations is long enough compared to the dwell time that it should be unlikely for two molecules to interact much when they are in the vicinity of the pore. Exploring this effect may be a very interesting avenue for further research with the NPN filters, but is probably beyond the scope of this publication so I mention it here for interests’ sake and we can discuss after we publish the first paper if this is a project worth pursuing further.
So here’s where we stand: we have evidence showing that the filter produces a global minimum in the coefficient of variance of the dwell time, most likely as a result of a reduction in conformational entropy prior to translocating the pore. We can use this effect to reliably separate populations of dsDNA with 500-bp resolution in the vicinity of the minimum in the CV. We have evidence that sometimes the NPN filter can have a strong effect on the probability of folding, but not always, suggesting that a small number of NPN pores are responsible for “feeding” the single pore and that the size of those pores is important. Together, these make a strong paper already. There is one more thing I would like to do, which is to try to use the NPN which I deposited with ALD Hafnia to show that with smaller pores, we can also have a more consistent effect on folding distributions. This would support the third point above and show that we can achieve an even more dramatic effect by tuning NPN pore properties, which will set the stage for yet more future work on this subject. I have a week or so before the lab shuts down to move, so I will try to get those experiments done in that time.
My impression so far is that the parameters we have chosen put us right on the edge of the range in which NPN will have an effect. The key is local confinement of the molecule, and the NPN pore size distribution/porosity/gap height parameters we have used to far result in a measurable, but fairly weak, confinement. I think we will be able to achieve more dramatic results by tuning these parameters, guided by what we’ve learned so far.
At some point in the relatively near future I’d like to skype with you guys and some of the Simpore guys to discuss what sort of flexibility there is in NPN and oxide parameters, which is where I see this project going after this publication.
Nice post, Kyle.
Which way would you wan to tune the NPN and oxide: thinner or thicker oxide? larger or smaller pores in NPN?
I think it will depend on what I see with the ALD NPN, but in an ideal case and assuming funding exists for it I’d like to explore the effect of NPN pore size (specifically, smaller pores, maybe around 10 and 20-nm average diameters, and higher porosity). It would also be enlightening to try both thinner and thicker oxides (100nm and 300nm, maybe) in order to see if the minimum CV shifts as expected or if the gap height has other effects.
The timeline I see is the following:
– Experiments carry on until the third week of October (~2 more weeks).
– The lab shuts down for ~2 weeks to pack and move
– During this time and in November Kyle starts writing a draft
– We aim at submitting the manuscript before mid-December
– We should plan to have new materials for Kyle to run experiments on for December/January. (I am happy to have a meeting to discuss what to and how soon).
Thanks. We’ve learned that we can address two aspects of fabricating the monolithic chip that’s been discussed as a possible next test specimen.
1) We can etch into underlying bulk silicon through NPN pores up to ~4 µm depth using XeF2.
2) We can make NPN over 750 nm thick poly-Si. Placed over a 10 or 20 nm thick SiN for the single pore membrane, this poly-Si layer could be etched out by XeF2 to leave a fluidic cavity between it and an over-coating NPN layer. The volume of the cavity would be adjusted by changing the poly-Si layer thickness and its patterned dimensions to control the amount of material that gets etched by XeF2. I believe that we could reduce the poly-Si thickness, but it will have an effect on the NPN pore size. There may be a couple of competing factors, so not sure which way it will go.
What sort of lateral resolution can you get with the XeF2 etch? Could you make 1-micron wells between the NPN and the SiN, or is it a global etch that simply removes all the poly-Si between the membranes?
I guess the top NPN would be patterned to only etch through a ~1um wide cavity in the poly-Si – or what ever size is required, but from what I understand Jamie, depending on the isotropy of the XeF2 etch the thickness of the poly-Si affect that cavity size?
We would be targeting to have 100nm (and 300nm) cavity height (i.e. the poly-Si thickness) and ~1um wide.
Vincent and Kyle:
We would probably have to test a range of patterned frontside “wells” in order to achieve a 1×1 µm opening through the NPN and poly-Si. There is some isotropy with XeF2, so some undercutting will happen. With 100-30 nm poly-Si, we will probably only need brief XeF2 treatment, so can limit undercut.
If the backside opening in the chip (which suspends the second SiN layer for the single nanopore) was aligned with one 1×1 µm frontside well or with multiple wells, which would you prefer? We have a 0.5 µm pore patterning mask with 1:1 pitch which we could use to try this monolithic structure. I think we could keep 0.5 µm from merging into one another.