Monocyte Transmigration in μSiM Devices – Optimizing Microporosity for Future Studies
Introduction
Infection or injury of tissue results in inflammatory signalling that motivates leukocyte recruitment to an inflamed location. Monocytes in particular are implicated in both pro inflammatory signalling through the M1 macrophage phenotype and regulation through the M2 macrophage phenotype. The μSiM devices developed in our lab have yet to assess/optimize monocyte transmigration from the blood compartment of the device to the tissue side, and this information is needed to further develop our platform for injury models. To fill this gap, we have assessed multiple microporous and dual-scale (nanoporous + microporous) silicon nitride (SiN) membranes in an effort to maximize monocyte transmigration rate and endothelial cell (EC) monolayer retention in a µSiM device. Previous work has shown that 3 µm circular pores are sufficient for facilitating neutrophil transmigration through both an EC layer comprised of human umbilical vein endothelial cells (HUVECs) and a 100 nm thick dual scale SiN membrane. Higher microporosities result in EC layer loss when media is exchanged in the bottom channel of a µSiM device (Figure 1) and in literature membranes used for monocyte transmigration studies in Transwells feature 5 µm pores. Transwell membranes are orders of magnitude thicker than SiN membranes, making it unclear if a 5 µm pore diameter is necessary for monocyte transmigration with SiN membranes due to an inherently lower resistance. This post will detail our monocyte transmigration study results and the characteristics of the dual scale membrane selected for future experiments.
Methods
Monocyte Isolation
Monocytes were isolated from whole blood obtained from a donor using a CD14 selection kit (Dynabeads FlowComp Human CD14 Kit, Thermo Fisher). The protocol for isolation is described in a previous post that can be accessed here.
HUVEC Monolayer Culturing in µSiM Devices
Device Prep:
- Assemble µSiM devices in a sterile environment (e.g. cell culture hood).
- Warm up media (MCDB-131 Complete, VEC Technologies).
- Sterilize assembled devices and petri dishes (150mm) under UV light for at least 15 minutes.
- Coat membranes with fibronectin (FN) at a density of 5 µg/cm^2 by incorporating 100 µL of FN solution into the top well of an ALine device. Leave the devices with fibronectin solution in the wells for at least 1.5 hours before removing.
- Add 100 µL of warm media into the top well, and prefill the bottom channel with media. Place devices in labeled petri dishes for each condition/membrane type.
- Moisten folded Kimwipes with 3 mL of sterile water (Ultrapure DNase/RNse-Free Distilled Water, Invitrogen). Place two per petri dish, ensuring no contact with devices.
- Place devices in an incubator (37 degrees Celcius, 5% CO2) until ready to seed.
Seeding with a confluent T25 flask (P4 or lower HUVECs):
- Warm up media (MCDB-131 Complete, VEC Technologies) and 1x Trypsin EDTA in a water bath.
- In a cell culture hood, empty media from T25 flask with an electronic pipette.
- Gently wash cells in the flask with 6 mL of 1x PBS (-Ca, -Mg, -Phenol Red) for 30 seconds, extract with pipette (2x).
- Add 1 mL of Trypsin EDTA, incubate for 2.5 minutes in an incubator (37 degrees C, 5% CO2).
- Gently shake flask on flat surface to detach HUVECs, pipette in 6 mL of media. Wash the flask 3 times with the same media.
- Extract all cells and pipette into a 15 mL conical. Count cells (take 10 µL) with a hemocytometer and calculate a cell suspension that leads to a 60,000 cells/cm^2 coating on the membrane surface area with 100 µL of fluid.
- Spin the 15 mL conical with cells at 500g for 5 minutes at room temperature.
- Aspirate media and resuspend the pellet with 500 µL of media. Use this as a base and then use your calculations to create suspensions that will properly seed devices.
- Seed devices and incubate, feed after two hours to remove non attached cells.
EC Monolayer Integrity
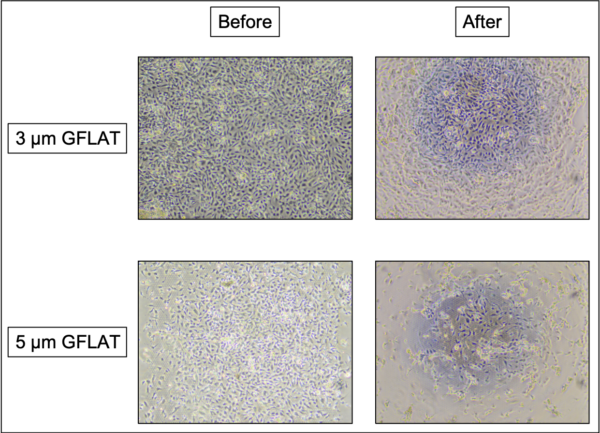
Images were taken with a phase microscope (4x lens) to assess EC monolayer integrity before and after incorporating fluid into the bottom channel of a µSiM device. Two membranes with HUVEC monolayers (~60,000 cells/cm^2) on them were imaged for this study (3 and 5 µm GFLAT).
Transmigration Experimental Design
First Round:
| 3µm DS | 3µm DS | 3µm DS | 3µm DS | 3 µm GFLAT | 5 µm GFLAT |
| +MCP-1, -TNF-α | -MCP-1, +TNF-α | +MCP-1, +TNF-α | -MCP-1, -TNF-α | +MCP-1, -TNF-α | +MCP-1, -TNF-α |
Second Round:
| 3µm DS | 3µm DS | 3 µm GFLAT | 5 µm GFLAT |
| +MCP-1 | -MCP-1 | +MCP-1 | +MCP-1 |
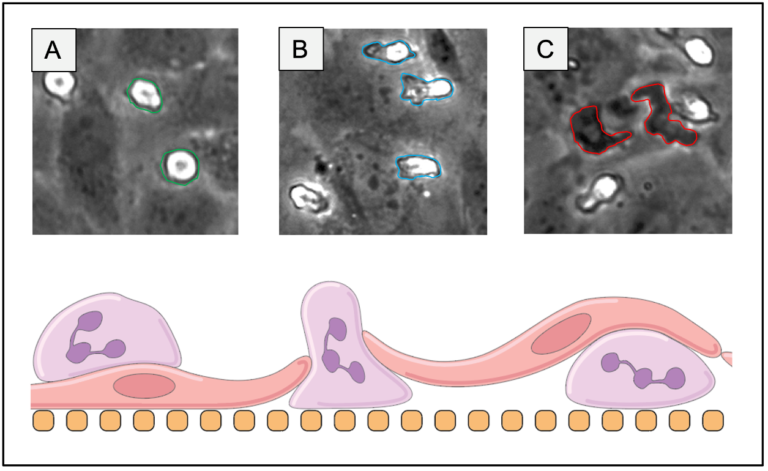
The above tables describe the utilized experimental conditions. Monocyte chemoattractant protein 1 (MCP-1) is added to the bottom channel of a device simultaneously with donor derived monocytes in the top well. For the GFLAT membrane devices, MCP-1 was introduced 3 hours before monocytes in order to allow for HUVEC resettling (high porosity resulted in HUVEC detachment). TNF-α was added at a concentration of 20 ng/mL into the top well 24 hours before monocytes were introduced. Approximately 20,000 monocytes were seeded onto each device, and seeded devices were left to incubate for at least 15 minutes before either endpoint studies (Round 1) or recordings (Round 2) were taken. For the round one experiments, endpoint studies were done by taking 10 µL of fluid from the bottom channel of each µSiM device after 24 hours and transmigrated monocytes counted with a hemocytometer. Twenty five minute videos of the round two experiments were taken with an epifluorescent microscope (20x LWD lens, phase, 1 frame/15 seconds) in the first two hours and once again after 15 hours. All devices were recorded inside of an atmosphere controlled incubation stage.
Computational Analysis of Membrane Pores
The three membranes used for transmigration studies were analyzed. This comprised of two GFLAT oxide (3 and 5 µm pores) and two dual scale SiN with 3 µm pores (0.625% and 1.25% porosity). Image montages of plain membranes were taken with an epifluorescent microscope in phase with a 10x lens (~0.850 pixels/µm at 2048 by 2048 resolution). The total membrane image was manually stitched together and computationally analyzed with the Wolfram language (Mathematica, Wolfram Research). Briefly, total membrane window images were binarized to emphasize pores as white pixels and background as black pixels. Clustered white pixels were taken as singular objects, ultimately counting as a pore. Each pore then had centroid, area, and eccentricity measured while outliers in these categories were removed with delimiters. Membrane characteristics such as porosity, pore number, and pore-pore distance were then calculated alongside a reference image from previous work done in this lab.
Results/Discussion
EC Monolayer Integrity
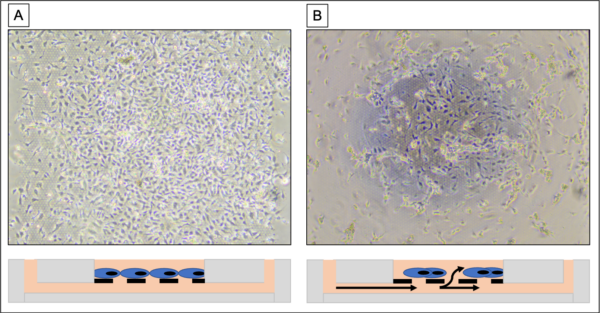
Images of the 3 µm NPN DS (~1.25% microporosity) were not taken for the integrity study, however the devices suffered no loss in EC integrity post feeding. Note that GFLAT membranes (with micropores only) had a higher microporosity than the NPN DS used in this study (~2-3x). Exchanging media in the bottom channel of a 3 µm GFLAT device resulted in slight loss of monolayer integrity with slight debris build up, while performing the same exchange with a 5 µm GFLAT device resulted in robust EC monolayer loss and debris formation (Figure 2).
The monolayers would reassemble if left alone in a an incubator over the course of three hours. Much of the debris would not disappear, however. This observation led us to note that any membranes made for future experiments should focus on minimizing porosity in order to avoid debris accumulation and cell death, while still being porous enough to promote monocyte transmigration events.
Monocyte Transmigration Counting Results
The first round of experiments involved 14 devices and among the 12 devices featuring DS membranes, no significant difference in transmigrated monocyte number was noted (Figure 3). The higher porosity GFLAT devices displayed more transmigration, with ~0.3% of seeded monocytes found in the bottom channel for the 3 µm GFLAT device, and ~0.45% for the 5 µm GFLAT device.
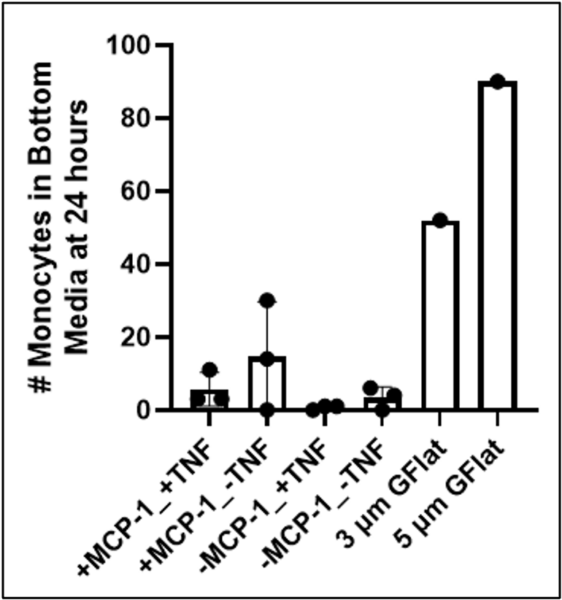
These values are dubious, however, as its unlikely that a transmigrated monocyte will end up free floating in the bottom channel. We suspect that most of the transmigrated monocytes stayed attached to the membrane on the other side, potentially biasing results. It may be possible to detach monocytes by flushing the bottom channel with trypsin, however this would be dangerous as cells in the top compartment of the device would likely be exposed too.
Videos of the Round 2 experiments can be seen here (one device per triplicate):
Initial seeding
- DS +MCP-1 T=0hr 12FPS
- DS -MCP-1 T=0.5hr 12FPS
- 3 µm GFLAT +MCP-1 T=1hr 12FPS
- 5 µm GFLAT +MCP-1 T=1.5hr 12FPS
Even after one hour post seeding we still see monocytes slowly falling onto the membrane surface, unlike neutrophils which typically settle faster. For future studies, incubating a seeded device for one and a half hours before recording an experiment may be necessary to ensure that we’re observing cells that are already on the EC monolayer.
15 hours post seeding
- DS +MCP-1 T=15hr 12FPS
- DS -MCP-1 T=15.5hr 12FPS
- 3 µm GFLAT +MCP-1 T=16hr 12FPS
- 5 mu GFLAT +MCP-1 T=16.5hr 12FPS
Transmigration through the membrane occurs frequently and is seen when a monocyte becomes de-focused. Visually, this manifests as an in focus monocyte turning into a defocus ring and disappearing altogether when near a micropore. The +MCP-1 devices appear to have much higher rates of transmigration when qualitatively compared to the -MCP-1 devices. We initially attempted to perform endpoint counting, however we weren’t able to count any cells despite clear video evidence of transmigration through the membrane occurring. One curious factor to note is that the monocytes in the 15 hour/+MCP-1 group appear to be more dynamic than those in the initial seeding group/-MCP-1. The presence of MCP-1 likely has a role to play, as its responsible for differentiating monocytes in macrophages.
Computational Extrapolations
After computational analysis, the following properties were compiled for the membranes used in this study.

Given the EC layer loss seen in the GFLAT devices, we decided to keep microporosity around 1% and a pore diameter of 5 µm as baselines for future manufactured membranes. Note that the DS membranes can be manufactured with different pore-pore distributions and pore diameters. Thus, the patterning of the 1.25% and 0.625% microporosity 3 µm pore DS membranes were selected at potential templates. We checked to see how porosity would change as a function of pore diameter, assuming we kept a similar patterning (Figure 4).
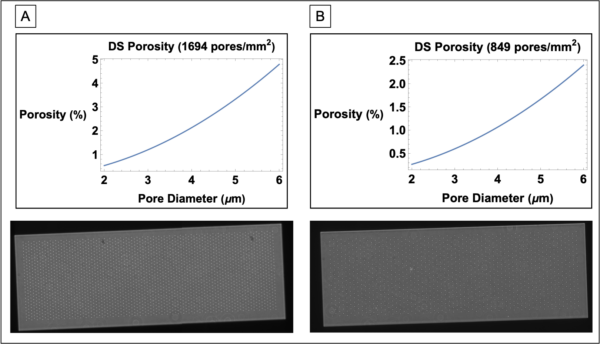
From our observations, manufacturing DS membranes with 5 µm pores would work best with a pattern similar to the 0.625% membranes (849 pores/mm^2) as this keeps porosity around 1%, while still retaining roughly 1 micropore per endothelial cell assuming a seeding density of 80,000 cells/cm^2.
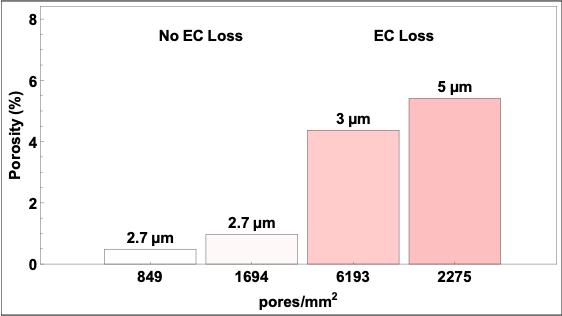
Key Takeaways
Monocyte transmigration works in our µSiMs, and we’re capable of seeing transmigration through both 3 and 5 µm pores. For future studies, we will be using DS membranes patterned at 894 pores/mm^2 with 5 µm pores. A summary figure has been added below:
Other (Failed) Experiments
Some studies used RAW 264.7 Murine Monocytes and TNF-α. TNF-α was added to the well of each device but resulted in EC layer death with a different media (RPMI) and was subsequently abandoned. EC layer integrity was later verified with TNF-α in MCDB-131 complete, indicating a potential deficiency in RPMI for these studies. The murine monocytes were problematic as they tended to clump together and differentiate into fibroblastic-like phenotypes. Comparing zero hour images to 24 hour images showed a large increase in murine derived monocytes as well, indicating rapid division, ultimately making endpoint counting results inaccurate.
Acknowledgements
Research/Analysis: Dan Ahmad and Raquel Ajalik
Support/Coordination with Blood Draws: Ma Rie Kim (Kim Lab)
Source for RAW 264.7 Cells: Yugo Morita (Schwarz Lab)