B.P with Thickness of Material
In an effort to understand the material property using burst pressure, a few key variables have to be analyzed to determine their effect on burst pressure. These variables are: 1) Shape : a) Maximum Dimension of the slot. b) Minimum Dimension of the slot. 2) Active Area. 3) Effective circumference. 4) Number of features on the chips. The data from my previous post was collected and reorganized.
The various graphs were plotted in an attempt to analyze the variables effect on the burst pressure.
Position Vs B.P


From the graphs it is quite apparent that the position of the chip with relationship to the center does not play a huge role in the strength. There does seem to be a slight lowering of B.P as we move away from the center.An outlier is the 4 slot ( with 2 vertical slots) 50 nm wafer. The general trend can to a certain degree be explained by the fact that the edges of the wafer see more “particulate” contamination than the points closest to the center. This could account for a slight decrease in B.P as we move away from the center. 2) Features Vs B.P
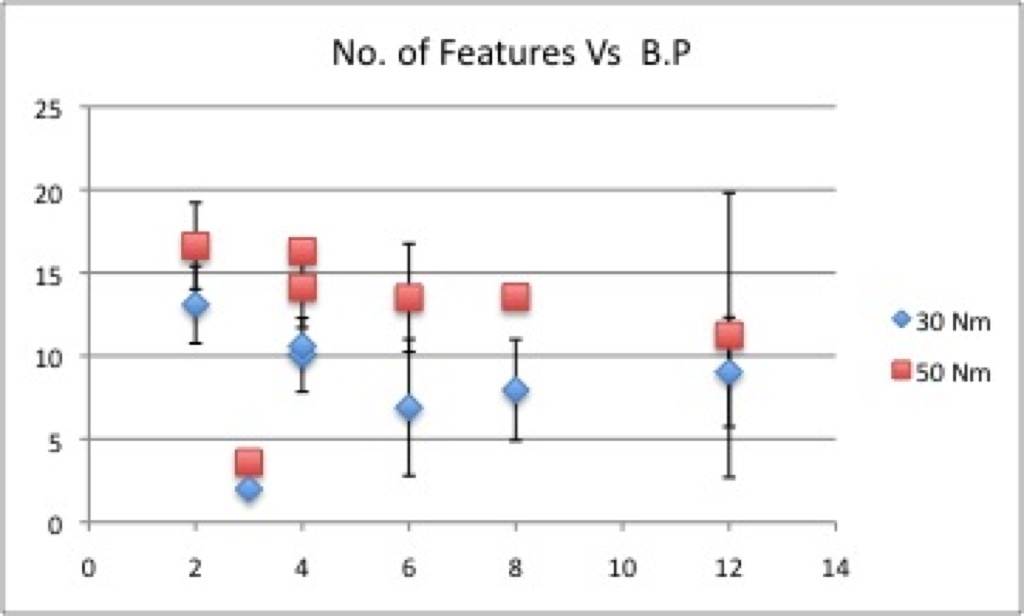
There seems to be a general decrease in B.P with increase in number of features with the exception of the 2nd point ( 3 Large slots).
3) Perimeter/Active Area Vs B.P
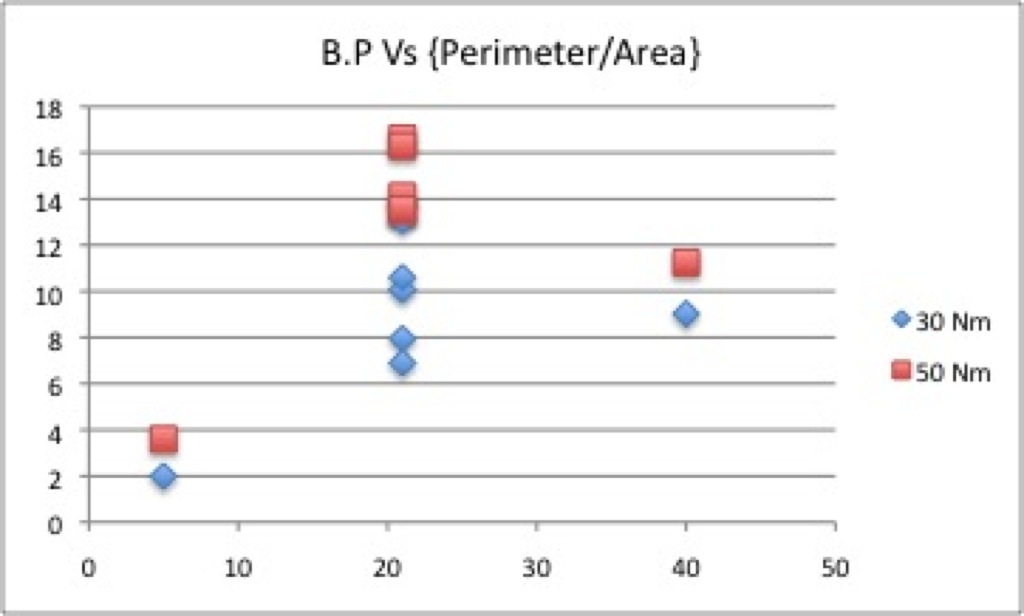
The center points represent the various slot patterns which have the same perimeter/Active Area.
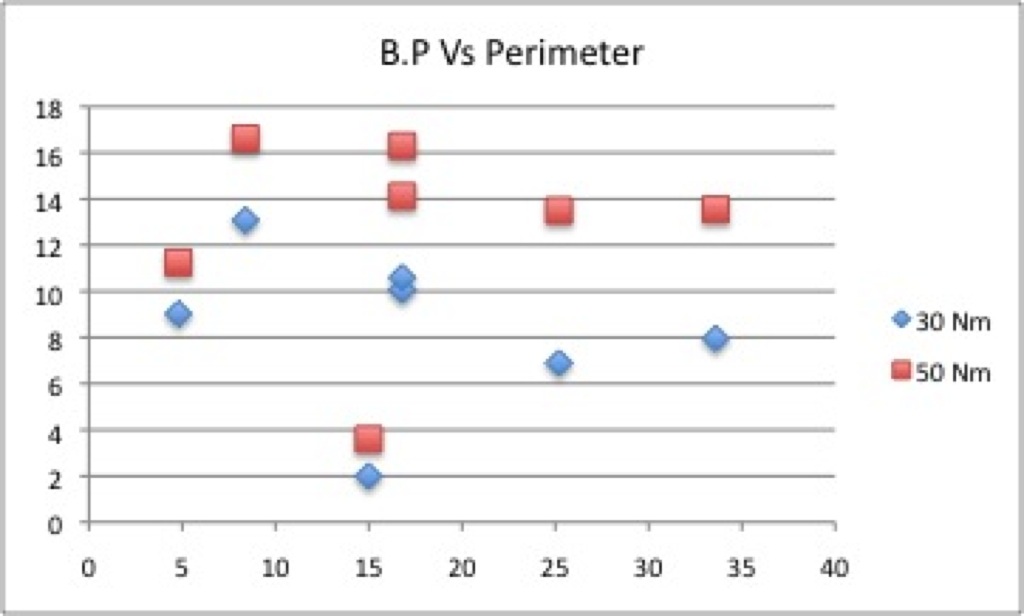
4) Perimeter Vs B.P
5) Perimeter/Area/Features Vs B.P
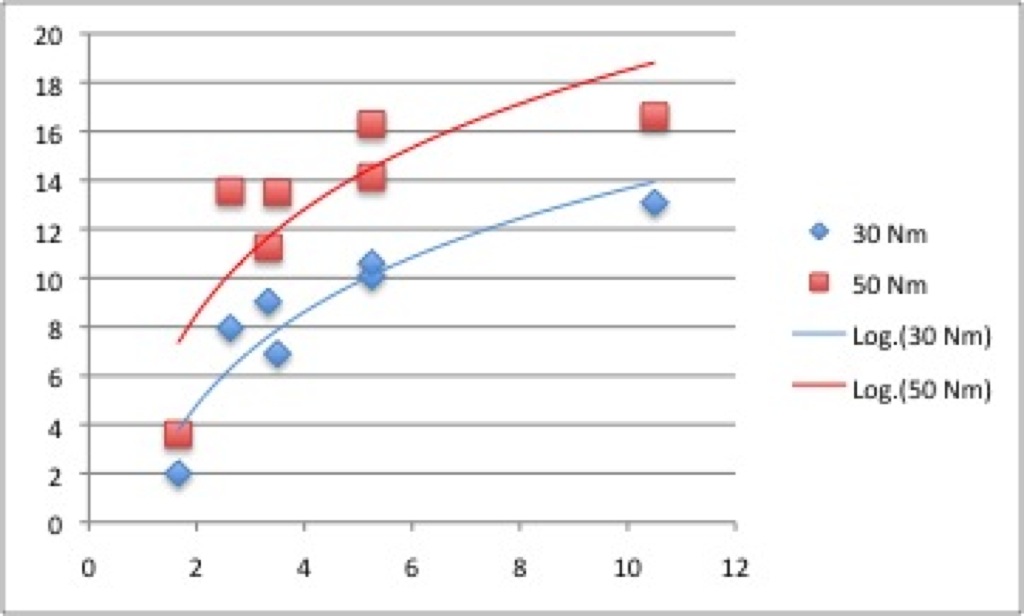
This is one the most informative graphs in the study. We could not explain all points on the graph with our previous explanations. These could not be considered outliers. This graph is able to explain all points of the data set. The points on the graph follow an exponential plot. This follows assumptions that an increase in active area on the slots / an increase in the number of slots/squares on the sepcon will lower our B.P