Plasma Urea Clearance of Liftoff Device
Introduction
This experiment is a continuation of previous work, cited below. Instead of urea spiked 1x PBS, whole heparinized bovine blood was pushed through the device over a period of four hours to then perform a urea assay on the separated and collected plasma. Please refer to the post below regarding the experimental setup that is not discussed here.
“Urea Clearance of Liftoff Devices” (Ferruzza, 2022)
https://trace-bmps.org/urea-clearance-of-liftoff-device/
Methods
As done previously, before blood was run through the device, I first performed a leak test using dH2O containing food coloring to observe if it bled through the membrane or not. The device passed the leak test and no color permeated the membrane after 30 minutes. After the leak test, the device was cleaned and re-primed by pushing 1x PBS through both channels until complete clearing of remnants was certain. For the plasma separation, whole heparinized bovine blood was pushed through a liftoff device at 25 uL/min with 1x PBS running counterflow at 50 uL/min. The samples were collected using a fraction collector timed to change sample tubes every hour, over a period of 4 hours, after which the previously completed sample was immediately stored in 4℃ for the following urea assay. The plasma was subsequently separated from the collected blood via centrifugation at 4℃ with the supernatant being moved to a separate tube to be used in the urea assay.
The assay took place using a 96-well plate with room to prepare a standardization curve as well as duplicates of each sample to minimize the effects of human error. The standard curve was created by generating six wells of 0, 20, 40, 80, and 100 nmol using the urea standard with an adjusted volume of 50 uL/well with dH2O. For the experimental samples, 6 uL of plasma was added per well and then adjusted to a volume of 50 uL/well with dH2O. The reaction mix was made following the procedure, and 200 uL of the mix was added to each well. Samples were subsequently assayed, obtaining absorbance data at 520, 505, & 495 nm.
I again measured the fluid output of both channels. In the same experimental set-up, as previously shown, urea spiked 1x PBS and 1x PBS were pushed counter to each other for an hour at the rates mentioned earlier. The output for the top and bottom channels was seen to hold a 3/2 ratio respectively after 1 hour. This suggests that fluids did not cross the membrane in a manner that may affect the results of the urea assay.
Results
The results for utilizing the 350 nm liftoff devices for urea clearance show a quick loss of urea, followed by a near asymptotic run-off. This is consistent with the data found in the previous test using urea-spiked 1x PBS. The results were recorded at three different wavelengths to account for discrepancies in procedure instructions between the plate and urea assay. The data at 520 and 505 nm are reliable with a low range of error with a clearance of 54.6% and 55.4 % respectively over 4 hours, but at 495 nm we can see discrepancies in values and error range despite the data coming from the same samples with the resulting clearance reaching 66.5% (Figure 1). The error bars were calculated with the standard deviation between the duplicates of samples from the same hour of the same run, showing the aforementioned discrepancies in some of the results. However, the data presented does indeed indicate that liftoff devices are viable for clearing urea from whole blood in this experimental setup.
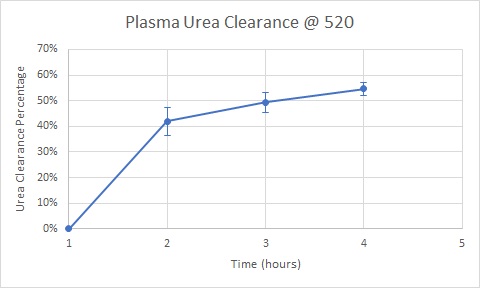
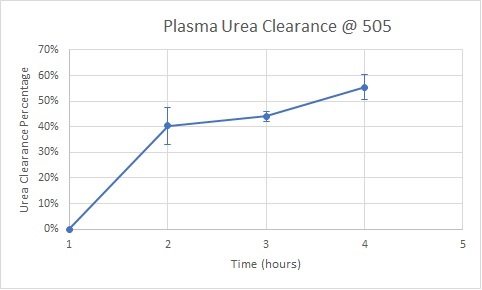
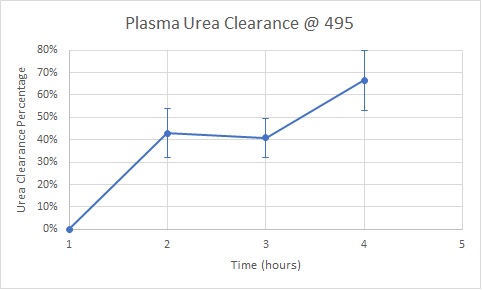
Figure 1). Urea clearance over a period of four hours. Results represent the percentage of urea cleared from the plasma analyte. The same sample set was used to perform a urea assay and was calculated at three different absorbance wavelengths.