Measuring changes in endothelial basement membrane integrity
Introduction
Inflammatory diseases have the potential to disrupt blood vessel permeability. This has serious ramifications for the blood-brain barrier (BBB), which is the interface between the vasculature and the brain. A healthy BBB allows essential nutrients to pass through while excluding molecules that might alter brain chemistry. If inflammation were to increase the BBB’s permeability this would eliminate the protective effect, and might promote development of neurological disorders such as Alzheimer’s and Parkinson’s diseases [1].
One important component of the BBB is the endothelial basement membrane (BM). The BM is composed of a collection of extracellular matrix proteins including collagen IV, laminin, nidogen, and heparan sulfate proteoglycans [2]. Together, these proteins provide a support structure for endothelial cells. The interaction between these proteins and cellular integrin β1 ties into a signaling pathway responsible for regulating claudin-5, which is a tight junction protein that contributes to maintaining a tight association between endothelial cells. Disrupting the basement membrane leads to decreased claudin-5 expression and increased vascular permeability [3]. The protein networks of the BM also directly demonstrate barrier functionality through size exclusion of some molecules and cell types [2]. The collagen IV component of the BM is digested by matrix metalloproteinase-9 (MMP-9), a protease that is upregulated following exposure to pro-inflammatory signals such as tumor necrosis factor-α (TNF-α) [4]. Thus, the disruption of BM may be a key event during inflammation of the BBB.
The goal of the µSiM-hNVU is to serve as a lab-on-a-chip model of the BBB. In order to validate the device’s function, we must ensure that the cells grown in the device are capable of producing an endothelial BM. Furthermore, an important milestone in the µSiM-hNVU’s development will be confirmation that changes in BM integrity can be quantified after exposure to pro-inflammatory agents. Before beginning work with the µSiM platform, we focused on preliminary imaging of BM protein fibers produced by cells on tissue culture plastic. Our first intention was to reproducibly generate large quantities of BM to facilitate fluorescence imaging. This was accomplished with human umbilical vein endothelial cells (HUVECs). It has been demonstrated that mixed culturing of endothelial cells and human dermal fibroblasts (HDFbs) may enhance basement membrane protein deposition [5], so this was evaluated alongside HUVEC monocultures. Our second intention for preliminary work was to ensure that changes in BM integrity could be measured following enzymatic digestion.
Note that our lab has prior expertise with imaging fluorescently-tagged extracellular matrix fibers and quantifying metrics such as fiber length [6].
Methods
Cell culture
HUVECs were obtained at passage 1 from Lonza (cat. no. C2519A) and grown in EGM-2 media + Bulletkit (Lonza, cat no. CC-3162) + 1% P/S. HUVECs were used up to passage 6. HDFbs were purchased from ATCC (cat. no. PCS-201-012) and frozen in liquid nitrogen at passage 2. They were subsequently thawed and cultured in DMEM/High glucose with L-glutamine, sodium pyruvate (ThermoFisher, cat. no. 11995065) +10% FBS + 1% P/S. HDFbs were used up to passage 6. Both cell types were incubated at 37C and 5% CO2. Media was changed every 2-3 days.
Seeding experiments
HUVECs and HDFbs were seeded into 24-well polystyrene plates (VWR, cat. no. 82050-892) and maintained in EGM-2 media + Bulletkit + 1% P/S, which was changed every 2-3 days. HUVEC monocultures were seeded at 3×10^4 cells/well. HUVEC/HDFb mixed cultures were seeded in a 2:1 ratio at two different densities: 4.5×10^4 cells/well and 3×10^4 cells/well. These two densities were selected to control for the total number of HUVECs as well as the total number of cells. Culture continued for 9 days prior to experimentation.
MMP-9 treatment
To investigate whether BM degradation could be detected, HUVEC/HDFb mixed cultures seeded at 4.5×10^4 cells/well were incubated with 100 µL of 0.5 µg/mL active human recombinant MMP-9 (Sigma-Aldrich, cat. no. PF140) diluted in PBS (Amazon, cat. no. 4010.200V0) for 2 hr at 37C and 5% CO2. Control cultures were treated with 100 µL PBS.
Imaging
Cells were washed with PBS prior to fixation with 3.7% formaldehyde for 15 min. They were then permeabilized with 0.1% Triton X-100 for 3 min before addition of anti-collagen IV antibody (1042) alexa fluor 647 (eBioscience, cat. no. 51-9871-82) and subsequent incubation for 2 hr. Nuclei were stained with DAPI (ThermoFisher, cat. no. D1306) for 3 min. A 1% formaldehyde storage solution was added to the cells prior to imaging. All microscopy was performed on a Leica DMI6000B with a Q-imaging Rolera EM-C2™ EMCCD Camera.
Analysis
Collagen IV fiber lengths and widths were determined using the publicly available CT-FIRE software v2.0 (University of Wisconsin-Madison, Laboratory for Optical and Computational Instrumentation). The software is able to extract fibers after applying the fast discrete curvelet transform [7]. Statistical analysis and plot generation was performed using R x64 4.0.2 (The R Foundation) and RStudio 1.3 (RStudio, PBC.). Plots were further enhanced with GIMP GNU Image Manipulation Program (The GIMP Team) and Fiji (Available: https://imagej.net/Fiji).
Results
Mixed culture BM deposition
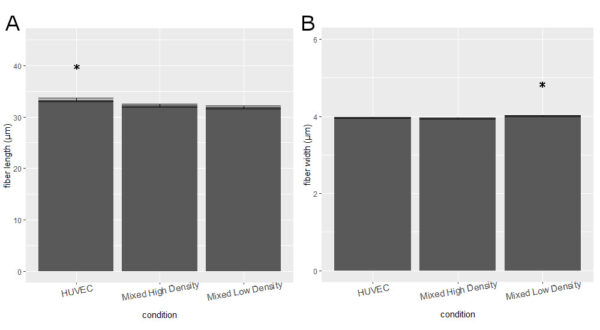
Collagen IV fibers were observed in all conditions (Fig. 1): HUVEC monoculture, mixed HUVEC/HDFb culture at high seeding density (4.5×10^4 cells/well) and mixed culture at low seeding density. Mean fiber lengths were statistically significantly higher for the HUVEC monocultures (33.31±0.37 μm) compared to the mixed high density (32.27±0.29 μm) and mixed low density (31.92±0.31 μm) groups (Fig. 2A). Mean fiber widths were statistically significantly higher in mixed low density wells (4.01±0.01 μm) compared to HUVEC monocultures (3.96±0.02 μm) and mixed high density (3.95±0.01 μm) wells (Fig. 2B). Notably, collagen IV fiber morphology appeared slightly different in the HUVEC monocultures compared to the other conditions, with more apparent large pores (Fig. 1B).

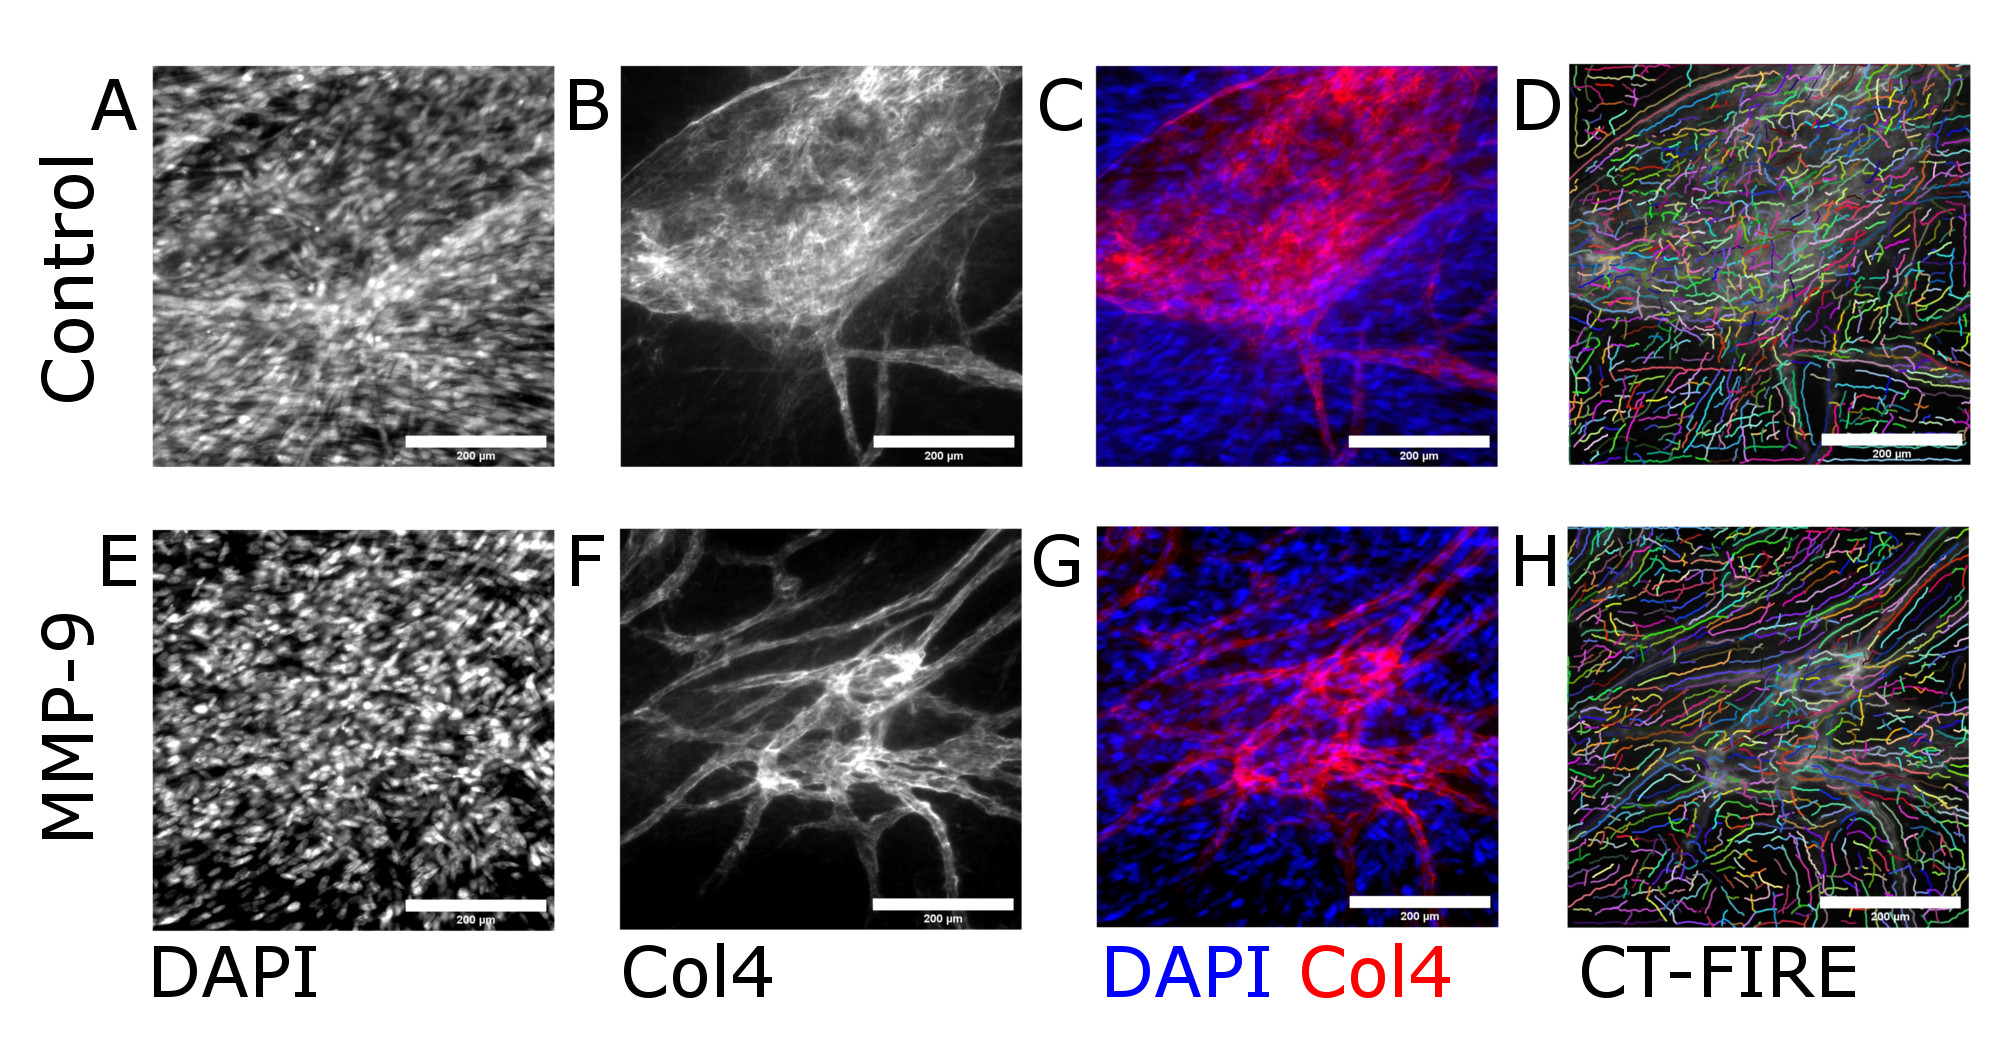
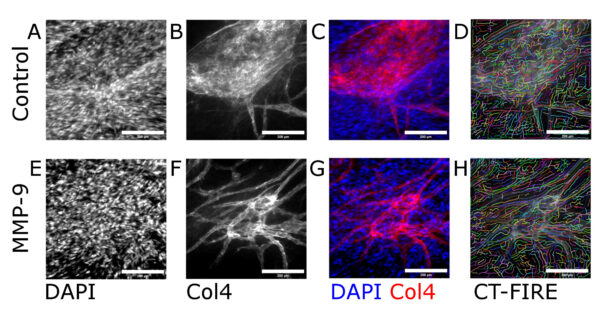
MMP-9 treatment
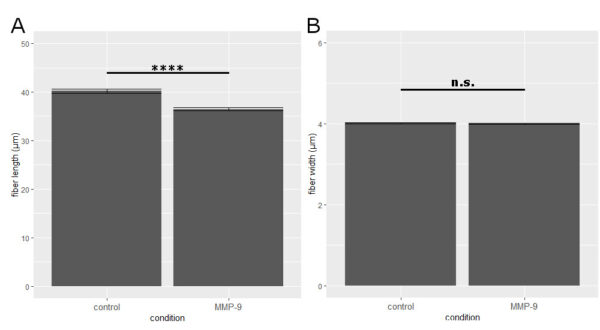
Following treatment with MMP-9, the mean collagen IV fiber length demonstrated a statistically significant reduction (36.45±0.31 μm) compared to untreated controls (40.19±0.44 μm) (Fig. 4A). Mean fiber width was not statistically significantly different between the MMP-9-treatment group (4.00±0.01 μm) and the untreated control group (4.02±0.01 μm) (Fig. 4B).
Discussion
The fact that HUVEC monocultures produced longer collagen IV fibers compared to the HUVEC/HDFb mixed cultures was unexpected given that mixing the cell types had previously been indicated to enhance BM protein deposition. However, it must be noted that while there was a statistically significant difference, there did not appear to be a practically significant difference. In other words, the lengths were still fairly similar. The most important conclusion that we draw from these experiments is that HUVEC monocultures may be sufficient for generating the quantities of BM required for further imaging tests without the need for an additional “mixing” step with other cell types. The alternate morphology of the collagen IV fibers in the different culture conditions requires further study. We are planning to set up indirect co-cultures of HUVECs and HDFbs to see if this is related to cellular signaling or if this behavior is caused by the direct contact of the different cell types.
We have demonstrated an ability to measure reduced collagen IV fiber length in response to digestion by MMP-9. While there was a statistically significant difference, we were expecting a more dramatic change – the mean length decreased by less than 10%. In the future, we plan to vary the concentration of MMP-9 as well as its incubation time. Furthermore, this will be used as a positive control while assessing the effects of pro-inflammatory signals such as TNF-α. Eventually we hope to develop a live imaging system capable of capturing a time series of the BM, which will be used to determine the BM integrity’s rate of change.
Our next steps include staining for laminin, another BM protein. While measuring fiber lengths and widths with CT-FIRE was a good starting point, we intend to incorporate other measures of BM integrity such as fiber density. We will also shift away from cell culture in 24-well plates and towards the µSiM in order to validate BM formation in this device. Once HUVECs have reproducibly demonstrated the ability to deposit BM proteins in the µSiM, they will be swapped out for different cell types to more appropriately model the BBB. Data from the HUVECs will be vital for honing our analysis techniques for the subsequent work.
References
[1] X. Cong and W. Kong, “Endothelial tight junctions and their regulatory signaling pathways in vascular homeostasis and disease,” Cellular Signalling, vol. 66, p. 109485, 2020/02/01/ 2020.
[2] C. Leclech, C. F. Natale, and A. I. Barakat, “The basement membrane as a structured surface – role in vascular health and disease,” Journal of Cell Science, vol. 133, p. jcs239889, 2020.
[3] T. Osada, et al., “Interendothelial claudin-5 expression depends on cerebral endothelial cell-matrix adhesion by β(1)-integrins,” Journal of cerebral blood flow and metabolism : official journal of the International Society of Cerebral Blood Flow and Metabolism, vol. 31, pp. 1972-1985, 2011.
[4] G. A. Rosenberg, E. Y. Estrada, J. E. Dencoff, and W. G. Stetler-Stevenson, “Tumor necrosis factor-α-induced gelatinase B causes delayed opening of the blood-brain barrier: an expanded therapeutic window,” Brain Research, vol. 703, pp. 151-155, 1995/12/12/ 1995.
[5] R. Costa-Almeida, M. Gomez-Lazaro, C. Ramalho, P. L. Granja, R. Soares, and S. G. Guerreiro, “Fibroblast-endothelial partners for vascularization strategies in tissue engineering,” Tissue engineering. Part A, vol. 21, pp. 1055-1065, 2015.
[6] H. H. Chung, S. M. Casillo, S. J. Perry, and T. R. Gaborski, “Porous Substrates Promote Endothelial Migration at the Expense of Fibronectin Fibrillogenesis,” ACS biomaterials science & engineering, vol. 4, pp. 222-230, 2018.
[7] J. S. Bredfeldt, et al., “Computational segmentation of collagen fibers from second-harmonic generation images of breast cancer,” Journal of biomedical optics, vol. 19, pp. 16007-16007, 2014.