Label Free State Analysis and Tracking: Neutrophils on HUVEC Monolayers
Introduction/Methods
As part of our investigation into neutrophil transmigration on tissue chip systems featuring HUVEC monolayers, I have been working on developing code for both cell state analysis and tracking using Wolfram Mathematica (and occasionally Python). This project relies on semantic segmentation via machine learning and microscopy video corrections, both of which have been described at length in previous posts. For both tracking and state analysis, our goal is to develop spatio-temporal profiles of individual cells as they interact with endothelial barriers and migrate in tissue-chip systems.
The machine learning model generates pixel color segmentation maps and class probability maps, both of which can be used for the assessment of cell state/tracking (Figure 1).
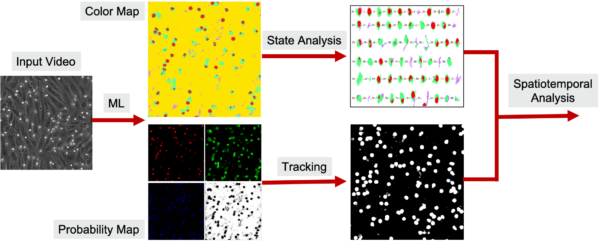
More specifically, the color map provides context to the state a cell is in (with particular emphasis placed on the transmigrated state, or phase dark) while the probability map for the “endothelial background’ class provides a high contrast map that can be used for cell tracking. For cell state, a feature extraction algorithm was written in Mathematica (using some built in functions) and extracted features were analyzed for pixel color count, total detections, false positives, false negatives, and duplicates. Filters were used to remove extraneous detections and limit detections to neutrophils only. A detected cell would be considered a member of a class (phase bright, probing, or phase dark) via simple majority, essentially checking the number of pixels for each class. The data was graphically plotted via Mathematica. Cell tracking was performed using a simple nearest neighbor linking algorithm (Figure 2). TrackPy and MOSAIC have also been explored as possible alternatives to a handwritten algorithm, but won’t be discussed in this work.

The generated tracks were visualized graphically and were also utilized to isolate a cell for an example video.
Results and Discussion
Cell State Analysis
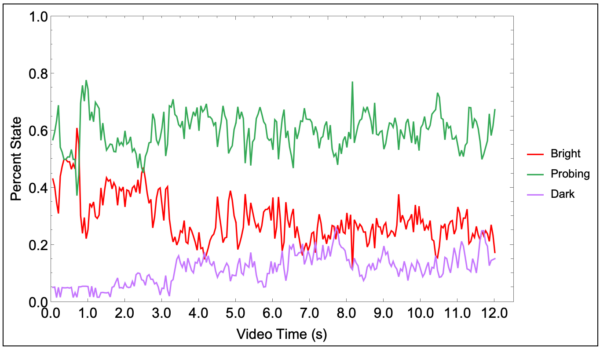
The color segmentation maps were used for analyzing cell state. For the sake of brevity, only results from the positive control condition will be discussed. The state analysis depicts roughly 18% of neutrophils entering a “phase dark” or transmigrated state by the end of the video recording (Figure 3).
The accuracy of these detections was assessed by manually counting neutrophils on three frames from the beginning, middle, and end of the video (Figure 4). Total detections, detections including multiples, and actual number of neutrophils in frame were displayed on the plot.
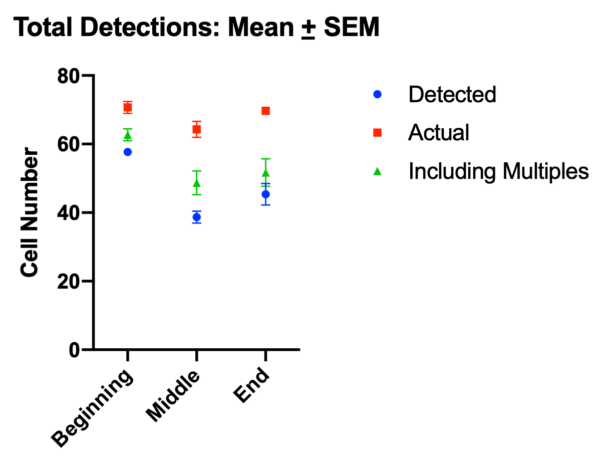
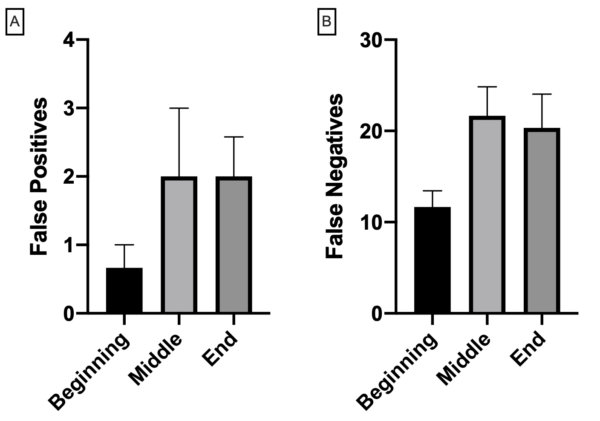
For detections excluding multiples, accuracy is in excess of 80% at the beginning of the video and drops to ~60% as the video progresses. The false positive detection rate is low, with ~1-2% of false detections in the beginning of a video, and ~3-4% towards the middle and end (Figure 5a). False negative detections are greater, which is expected given the conservative nature of the algorithm (Figure 5b).
Improvements can be made in the future, but for now the capabilities of the current algorithm exceed previously utilized code. A clear limitation is the inability to differentiate between multiple neutrophils clumping together, especially when the morphology of each cell is distinct (i.e. blob like). These nuances may be corrected for in the future with more robust algorithms.
Cell Tracking
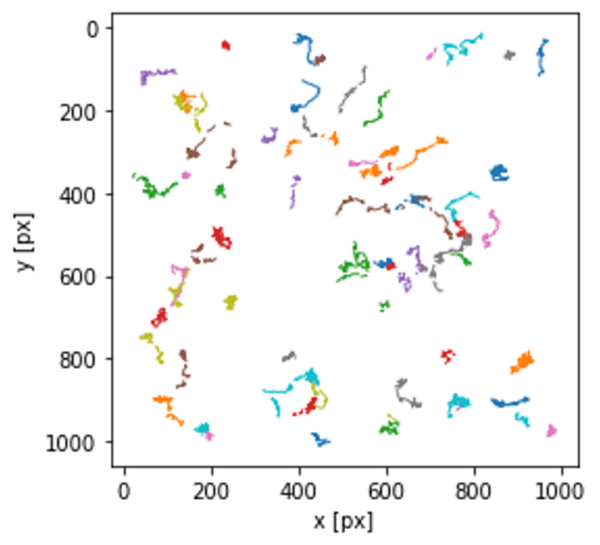
The nearest neighbor linking approach is currently written to be conservative, cutting off tracking if a close neighbor (10 pixel radius) cannot be found in the next frame. Future frame detections are currently being worked on, and other tracking mechanisms such as TrackPy and MOSAIC are currently being evaluated. Results for the tracking can be seen in Figure 6.
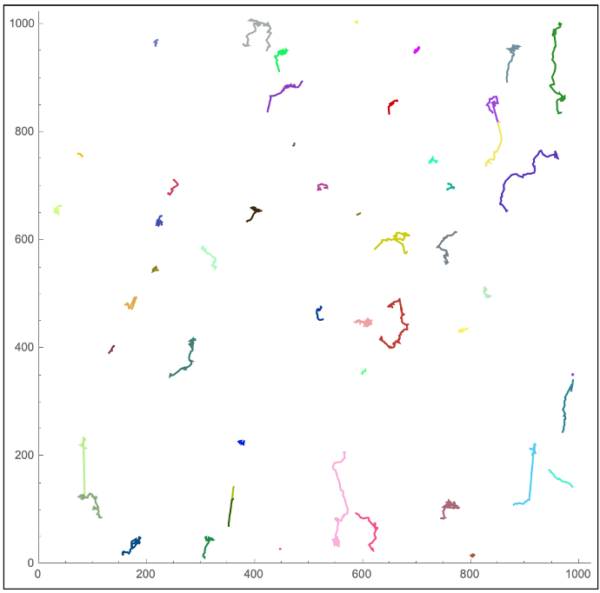
With these tracks, it is possible to isolate a neutrophil and follow changes in its spatiotemporal state. This may provide useful context for instantaneous velocity, as well as locations at which transmigration occurs (i.e. hotspots).
Conclusions
The state analysis and tracking presented here build upon previous work and are capable of providing robust answers with respect to neutrophil state on a tissue chip system. There are key limitations to note, however. With respect to segmentation and state analysis, fully isolating phase dark cells from the endothelial background is difficult. Improved solutions such as the deep learning algorithm “Unet” may provide enhanced capabilities for this separation and will be explored later. Part of this inability to fully discriminate phase dark neutrophils may come from the microscope apparatus itself and the recorded video quality. We plan on utilising a more modern microscope for all future experiments, which would also allow us to utilize live cell staining. With respect to tracking, neutrophil tracking is lost both due to clustering and due to conservative coding. While the coding can be iterated upon, the clustering is an issue that may require changes such as lowered seeding density or fluorescent labels.
Currently I’m working on utilizing watershedding as a means to separate neutrophils that are spatially close to each other and other tracking algorithms, there’ll be more on this later, but for now here’s a preview: