Progress Toward Modeling Inflammation-Mediated Degradation of Basement Membrane Proteins in the μSiM-hNVU
Introduction
The blood-brain barrier (BBB) plays an important role in maintaining brain chemistry by restricting the permeability of small molecules and cells. Inflammatory diseases may disrupt the BBB and promote the development of neurological disorders [1]. One potential mechanism of BBB disruption is the degradation of the extracellular matrix proteins that make up the endothelial basement membrane (BM). The BM is composed primarily of collagen IV and laminin networks that are linked by nidogen, perlecan, and heparan sulfate proteoglycans [2]. These proteins provide a support structure for endothelial cells, and it is believed that cellular adhesion to collagen IV is part of a pathway responsible for upregulation of the tight junction protein claudin-5 [3]. The tight junctions are the key to limiting endothelial permeability, since they restrict paracellular migration of small molecules. Thus, the BM helps maintain the barrier function of the BBB in two ways: its networks act as physical impediments to molecular diffusion, and they help sustain tight junctions. BM proteins are degraded by matrix metalloproteinase-9 (MMP-9, also known as Type IV Collagenase or Gelatinase B), which is upregulated by pro-inflammatory signals such as tumor necrosis factor-α (TNF-α) [4]. This could be an important link between inflammation and BBB disruption. Our goal is to model this effect using the μSiM-hNVU.
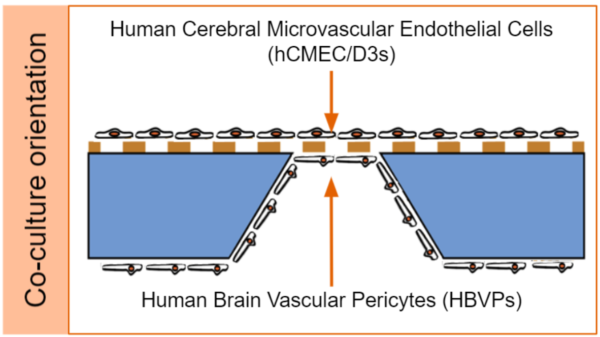
This post is intended to serve as both a recap of prior relevant blogposts as well as a summary of new results from over the past 7 months. The majority of this work has been performed by co-culturing two cell types (Fig. 1): a human cerebral microvascular endothelial cell line (hCMEC/D3; Sigma-Aldrich cat. no. SCC066) and primary human brain vascular pericytes (HBVPs; ScienCell cat. no. 1200). Co-culturing is accomplished by coating the trench side of the μSiM membrane with 2 μg/cm2 poly-L-lysine prior to “trench-down” device assembly, followed by inverted seeding of the HBVPs. hCMEC/D3s are seeded in the 25 µg/cm2 collagen I + 5 µg/cm2 fibronectin-coated top well 1-2 days later. Devices are subsequently maintained for 6-8 days prior to starting experiments to ensure that there is sufficient time for BM protein deposition.
Results
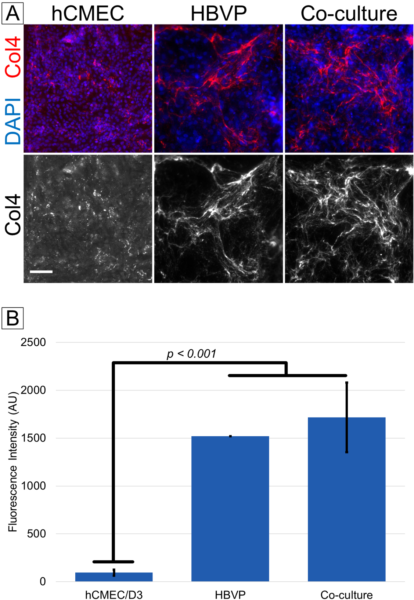
In February 2021, we demonstrated that the majority of collagen IV deposited on the μSiM membrane was due to the HBVPs (Fig. 2). Little collagen IV appeared to be present in hCMEC/D3 monocultures compared to HBVP monocultures or co-cultures. This experiment was repeated in November 2021 to make up for small sample sizes, and the results were consistent.
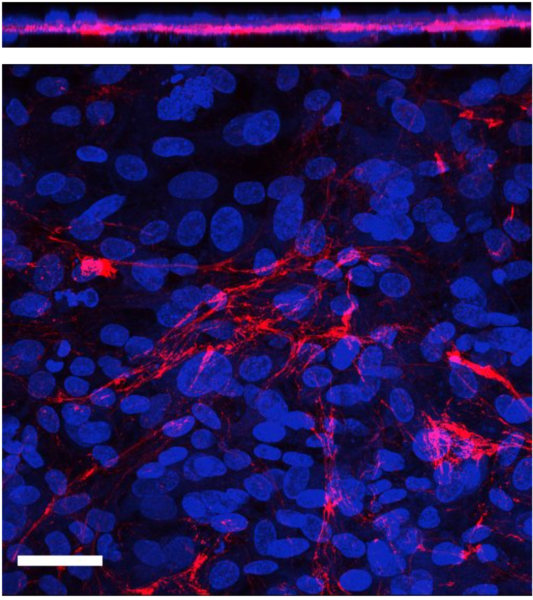
There have been a few attempts to capture high quality Z-stacks with confocal microscopy in order to produce 3D reconstructions that show the position of collagen IV relative to the cells. We expect collagen IV to appear below the hCMEC/D3 layer, while HBVPs may either be below or embedded in the collagen IV. Preliminary images seem to support our expectations (Fig. 3). We plan to stain an endothelial marker such as CD31 or a tight junction protein such as ZO-1 in order to better distinguish the hCMEC/D3 layer from the basement membrane.
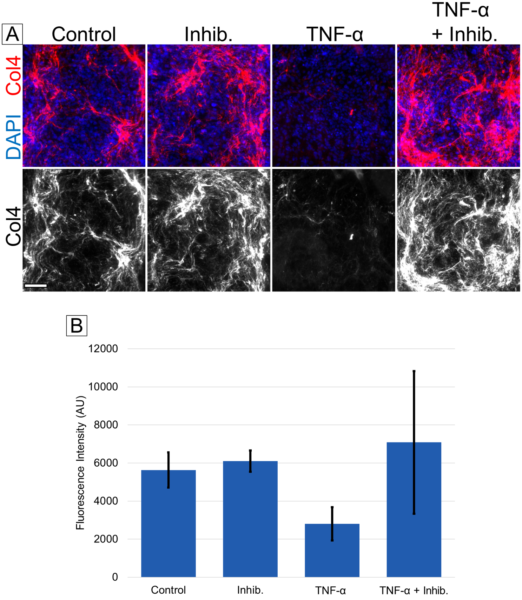
In our early efforts to model inflammation-mediated degradation of BM proteins, we realized that TNF-α treatment times on the order of 24 hr were more appropriate than approximately 6 hr treatments. Since then, we have shown that 20 ng/mL TNF-α causes apparent degradation of collagen IV (Fig. 4). However, the presence of several outlier images necessitates a repeated run of this experiment. Treatment with 100 μg/mL MMP-2/MMP-9 Inhibitor I (Sigma-Aldrich, cat. no. 444241) was able to rescue the collagen IV. The concentration for the inhibitor was chosen after examining its ability to attenuate the effects of 100 ng/mL MMP-9 in a dye-quenched gelatin assay (see prior post). However, the concentration of MMP-9 used in the dye-quenched gelatin assay was arbitrary and did not necessarily reflect the amount of MMP-9 activity generated in the μSiM platform.
We sought to quantify the concentration of MMP-9 produced by our model cell types during TNF-α stimulation. The LSBio Human MMP9 / Gelatinase B ELISA Kit (LS-F161) was selected since its assay range of 8.23-6000 pg/mL covered a range of MMP-9 concentrations produced by our cell types (or similar cell types) found in the literature (Table 1). We created mixed cultures of hCMEC/D3s and HBVPs (12:5 ratio) in multiwell plates, and collected conditioned media after 7 days. Unfortunately, the amount of MMP-9 detected in our samples was below the assay range, even when the samples were treated with TNF-α for 24 hr prior to sample collection. We may need to pursue amplification-based techniques such as RT-qPCR, especially once we move back to the smaller cell populations in the μSiM co-cultures. It may also be important to investigate techniques that can assess MMP-9 activity, such as gelatin zymography, since ultimately the activity level should determine the amount of BM degradation occurring at the BBB.
| Paper | Cell Type(s) | Culture Vessel | ELISA Kit | MMP-9 Concentration |
| Yang et al. (2016) [5] |
hCMEC/D3 Human astrocytes |
0.4 μm transwells | ELISA Kit (Jiamay, FHK0144) |
50-100 pg/mL (200-300 pg/mL after stimulation with BzATP or IL-1β) |
| Kuo et al. (2018) [6] |
HBMEC HBVP human astrocytes |
Transwells in 24-well plate | MMP-9 microtiter plate (Abnova) + ELISA reagents (Thermo Fisher) |
12.0-55.6 pg/mL (depends on cell ratios and conditioned media treatment) |
| Zhang et al. (2019) [7] |
HUVEC HBMEC HBVP |
12-well plates | ELISA Kit (R&D Systems) |
ECs: 50-80 pg/mL (~100-150 pg/mL after stimulation with GF1) HBVPs: ~20 pg/mL (~45 pg/mL MMP-9 after stimulation with GF1) |
| Dohgu et al. (2019) [8] |
RBEC Rat pericytes |
24-well plates (possibly with 0.4 μm transwells) | Rat Total MMP-9 Quantikine ELISA Kit (R&D Systems) |
ECs: ~0 ng/mL Pericytes: ~0 ng/mL (9.3 ± 2.3 ng/mL after stimulation with α-synuclein) |
Table 1. MMP-9 concentration values produced by similar cell types in the literature
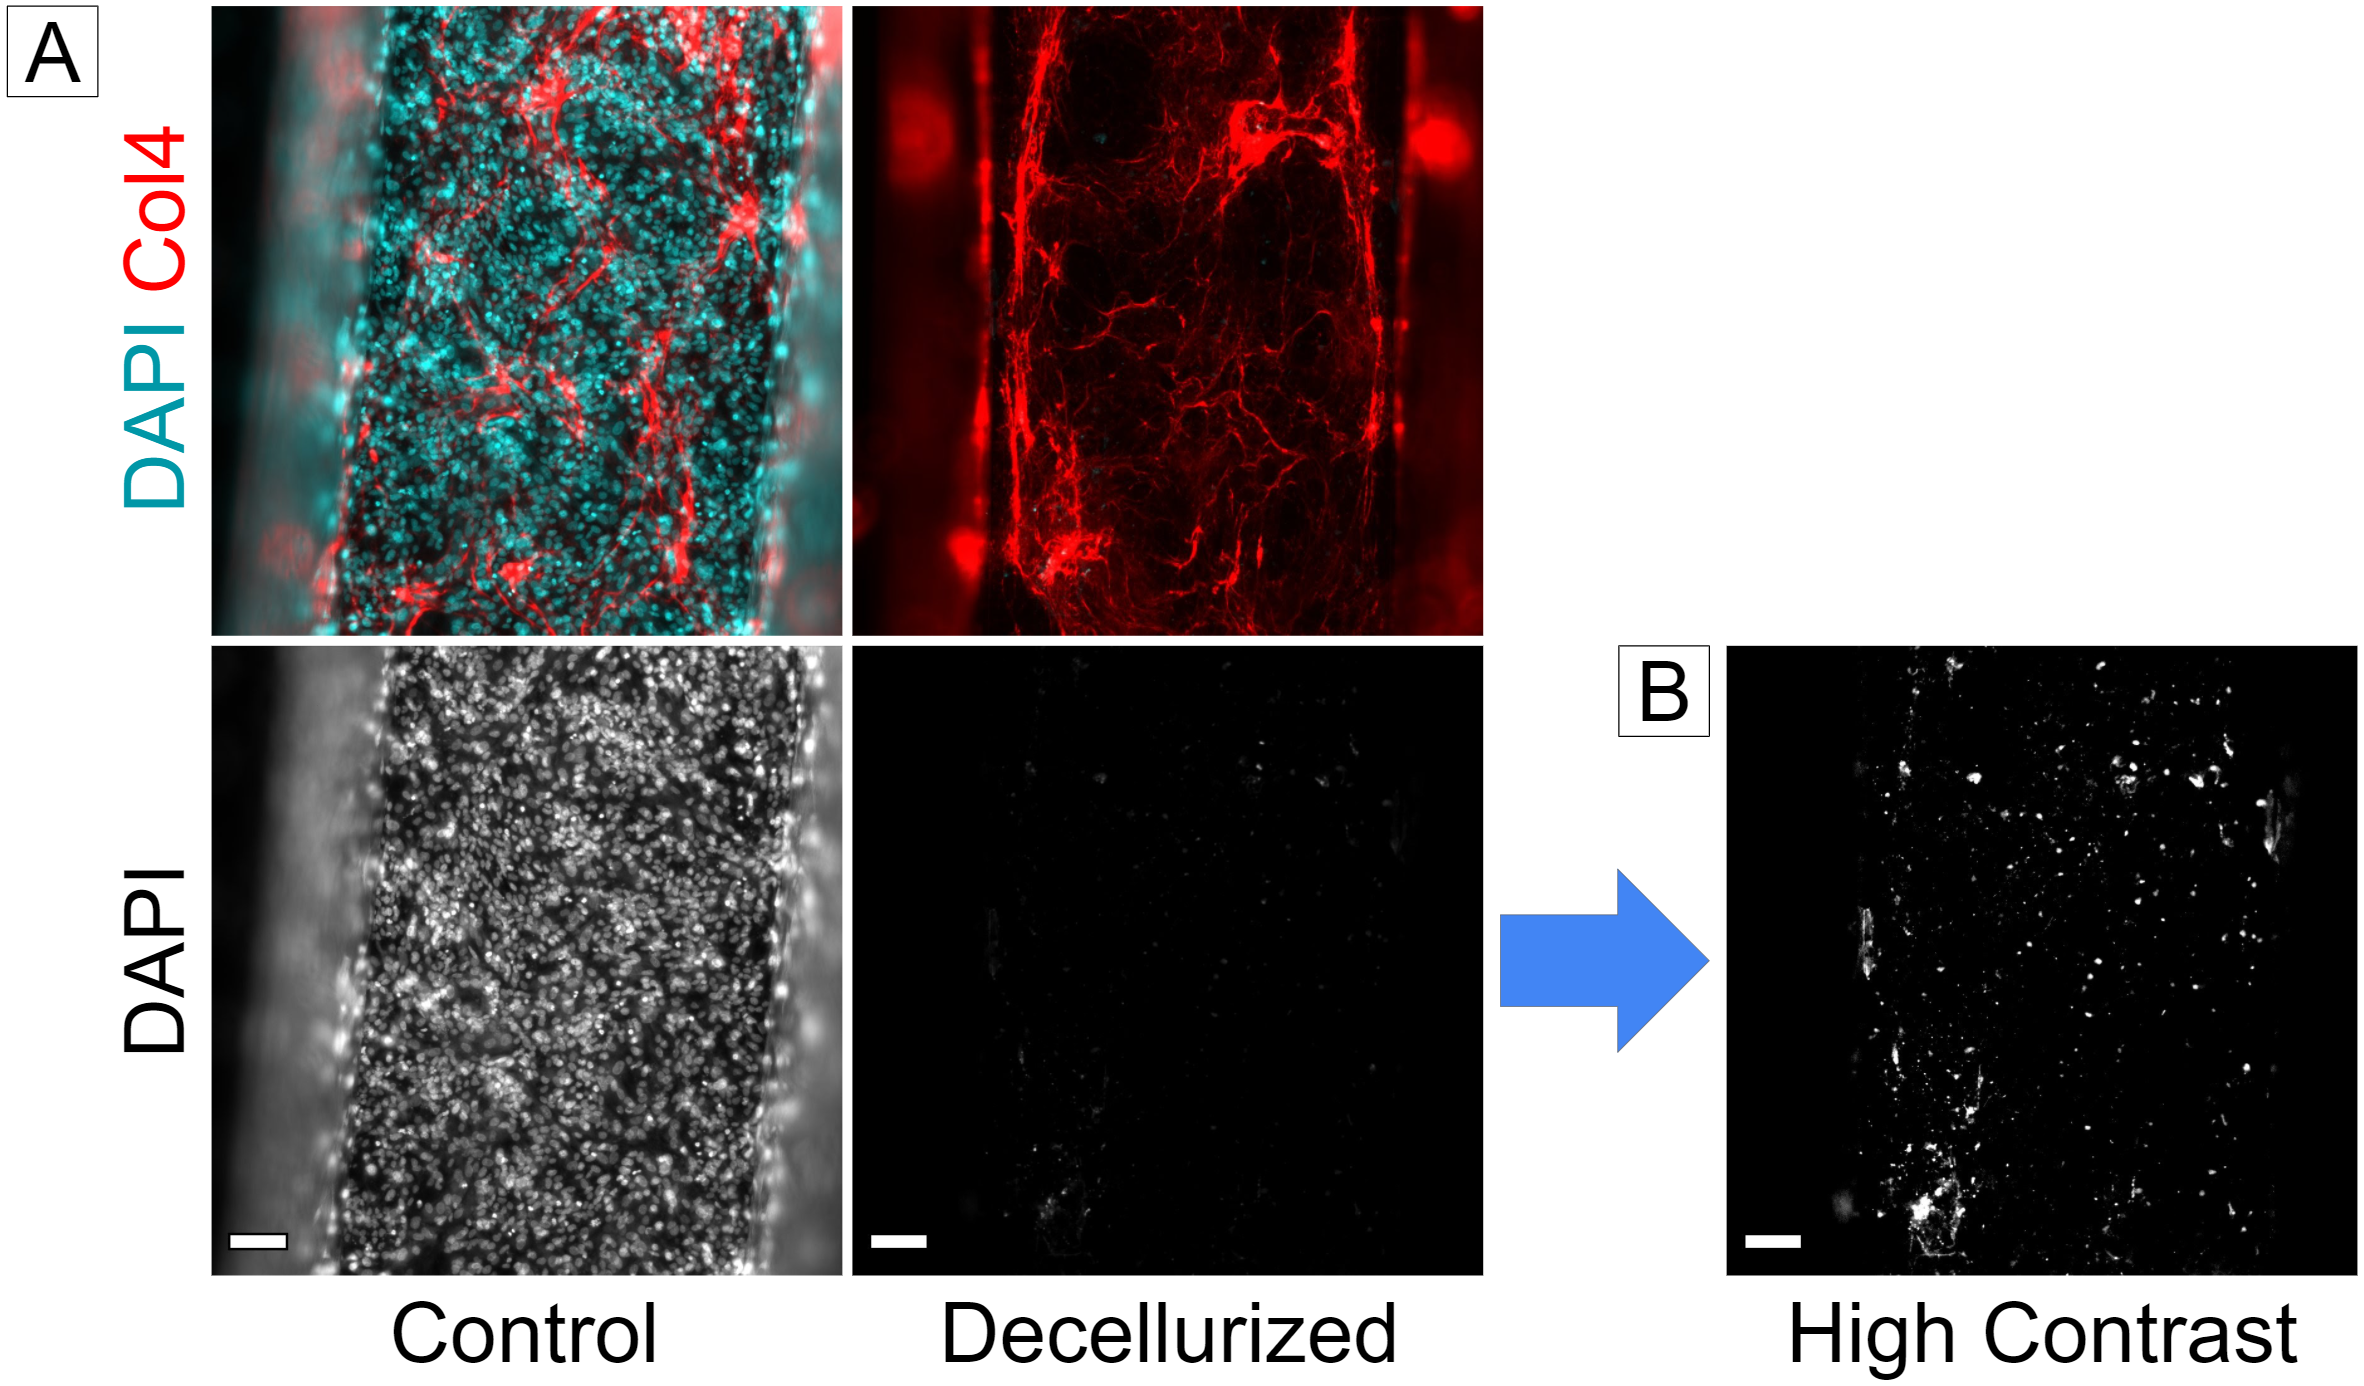
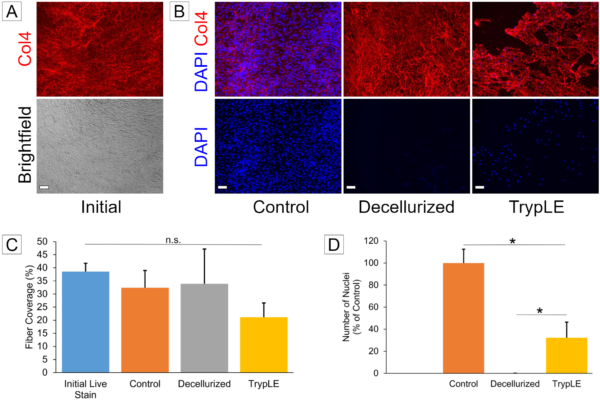
Recently, we have treated samples with 0.5% Tx-100 + 20mM NH4OH in order to decellurize the BM [9]. Isolating the BM in this manner may allow us to see how much it directly contributes to barrier function. We tested if this technique was able to remove cells from tissue culture plastic before moving to the μSiM. Both HBVPs (Fig. 5) and hCMEC/D3s (not show) were destroyed by the treatment, though small amounts of nuclear material remained. The HBVPs laid down significant quantities of collagen IV, so they were used to examine whether this approach would preserve extracellular matrix proteins. Prior to the treatment, some wells were live-stained for collagen IV to double check whether any basement membrane protein was lost as a result of the treatment or subsequent staining process (Fig. 5A). There was no difference in the amount of collagen IV left behind (Fig. 5C). TrypLE treatment was intended to serve as a positive control for collagen IV degradation, but it is likely that the treatment time (3-6 min) was insufficient to yield much protein destruction.
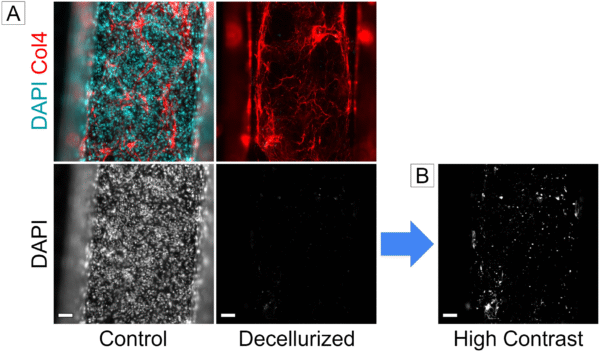
We also confirmed that this decellurization technique worked in the μSiM (Fig. 6A). To remove nuclear material, we treated the samples with 1 μg/mL DNase I for 15 min. However, trace amounts of DNA remained despite the DNase treatment (Fig. 6B). It may be necessary to extend the DNase treatment times or to increase the concentration. It is also possible that fragmented DNA simply remains electrostatically bound to the substrate following digestion.
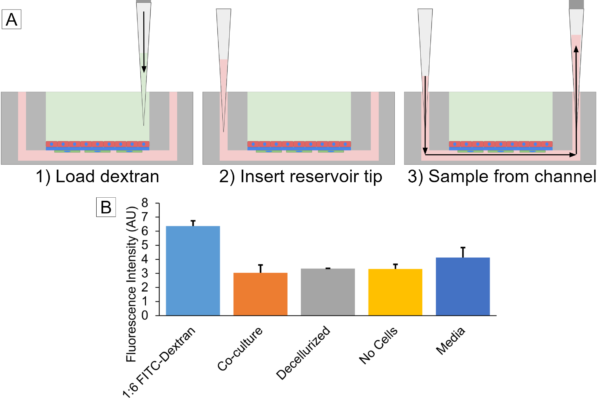
We began exploring whether the decellurized basement membrane would have any effect on permeability. Decellurized μSiMs were compared to μSiMs with live co-cultures as well as μSiMs that were never seeded with cells. ~1mg/mL 10 kDa fluorescein-dextran mixed in media was added to the top wells of the devices, and was allowed to diffuse across the membrane for 15 min at 37°C. Then, a pipette containing 50 μl of media was inserted into one of the lower channel inlets prior to aspirating a 50 μl sample from the other inlet per the protocol previously described by Molly (Fig. 7A). Samples were added to a 96-well plate along with blank media and 10 kDa Fluorescein-Dextran diluted to mimic the final sample concentration had it reached equilibrium in the μSiM. There was no difference in fluorescence intensity between any of the sample conditions (Fig 7B). Either there was poor barrier integrity in all conditions or it may be necessary to allow longer diffusion times prior to sampling. The blank media wells had higher fluorescence values compared to the samples coming from the μSiMs, which should not be possible. The devices were fixed and stained for collagen IV following the permeability experiment to verify that the decellurization protocol had worked correctly.
The loss of pericytes is another potential route for BBB disruption [10]. Using our lab’s expertise in live cell tracking, we have begun to examine the effects of TNF-α and MMP-9 on HBVP migration on tissue culture plastic. TNF-α accelerated HBVP movement in a dose-dependent manner (Fig. 8B). Treatment with MMP-2/MMP-9 inhibitor I reduced migration speed below baseline levels, which makes sense given that the cells should always be secreting some gelatinases as part of regular ECM turnover (Fig. 8D). The MMP inhibitor concentration used in these experiments was arbitrary (see above), and these experiments may need to be repeated with a different concentration determined after we successfully quantify the amount of MMP-9 secreted by the cells. Furthermore, the experiments with MMP inhibitor were carried out using a scratch wound assay (Fig. 8C). In the future, we plan to exclusively focus on random migration since it is more representative of conditions in vivo. Note that there are two hypotheses for MMP-9’s role in HBVP migration. One is that HBVPs are “freed” to migrate as MMP-9 degrades more of the basement membrane substrate. Other researchers have indicated that MMP-9 itself may act as a signaling molecule to promote pericyte migration [11]. In the future, we may be able to target the non-catalytic hemopexin domain to see if this inhibits the increase in HBVP migration without inhibiting digestion of the basement membrane.
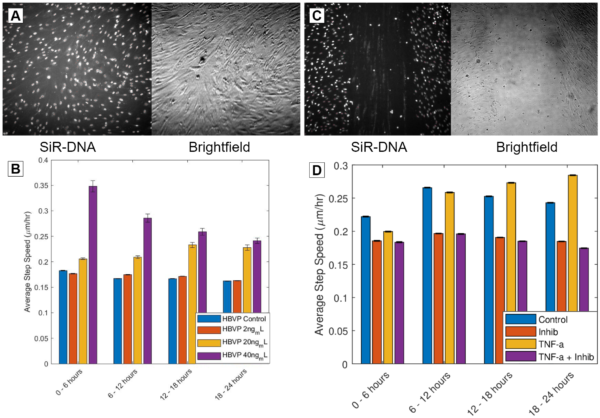
In addition to the work on tissue culture plastic, we have begun optimizing live tracking in the μSiM. The SiR-DNA nuclear stain that we use labels both the hCMEC/D3s and HBVPs. In order to distinguish between the two cell types, we have seeded the HBVPs on the bottom of the lower channel. This allows us to focus on one cell layer at a time, though there is substantial background fluorescence when focusing on the HBVP layer. The μSiMs are placed in a 12-well plate which is located in our microscope’s stage top incubator. We initially had problems with μSiMs sliding out of position over the course of the tracking period, but we have overcome this issue by applying vacuum grease on the bottom of the μSiMs in a region that does not obscure the membrane window. More work will be required to overcome the issues with background fluorescence. Ultimately, it may make sense to utilize GFP-expressing pericytes so that the two cell types can be tracked in separate fluorescence channels.
Conclusion
We have seen that treatment with the pro-inflammatory cytokine TNF-α results in loss of collagen IV and increases migration of HBVPs. It appears that MMP-9 is involved in the pathway leading to these effects, but we require more experiments to demonstrate its involvement. Specifically, we would like to quantify changes in MMP-9 activity and gene regulation during inflammation. We would also like to evaluate how much MMP inhibitor is required to attenuate the effects of TNF-α. We plan to continue investigating if the basement membrane contributes directly to barrier function by evaluating decellurized matrices’ effect on permeability. And finally, we would like to confirm whether MMP-9-influenced HBVP migration is due to basement membrane loss or signaling from the MMP-9 itself.
References
[1] X. Cong and W. Kong, “Endothelial tight junctions and their regulatory signaling pathways in vascular homeostasis and disease,” Cellular Signalling, vol. 66, p. 109485, 2020/02/01/ 2020.
[2] C. Leclech, C. F. Natale, and A. I. Barakat, “The basement membrane as a structured surface – role in vascular health and disease,” Journal of Cell Science, vol. 133, p. jcs239889, 2020.
[3] T. Osada, et al., “Interendothelial claudin-5 expression depends on cerebral endothelial cell-matrix adhesion by β(1)-integrins,” Journal of cerebral blood flow and metabolism : official journal of the International Society of Cerebral Blood Flow and Metabolism, vol. 31, pp. 1972-1985, 2011/10// 2011.
[4] G. A. Rosenberg, E. Y. Estrada, J. E. Dencoff, and W. G. Stetler-Stevenson, “Tumor necrosis factor-α-induced gelatinase B causes delayed opening of the blood-brain barrier: an expanded therapeutic window,” Brain Research, vol. 703, pp. 151-155, 1995/12/12/ 1995.
[5] F. Yang, K. Zhao, X. Zhang, J. Zhang, and B. Xu, “ATP Induces Disruption of Tight Junction Proteins via IL-1 Beta-Dependent MMP-9 Activation of Human Blood-Brain Barrier In Vitro,” Neural Plasticity, vol. 2016, p. 8928530, 2016/10/04 2016.
[6] Y.-C. Kuo, C.-L. Lee, and R. Rajesh, “Regulation of human brain vascular pericytes and human astrocytes in a blood–brain barrier model using human brain microvascular endothelial cells: Expression of TGF-β1, VEGF, MMP-9 and P-gp,” Journal of the Taiwan Institute of Chemical Engineers, vol. 86, pp. 9-17, 2018/05/01/ 2018.
[7] J. Zhang, et al., “Ginsenoside F1 promotes angiogenesis by activating the IGF-1/IGF1R pathway,” Pharmacological Research, vol. 144, pp. 292-305, 2019/06/01/ 2019.
[8] S. Dohgu, F. Takata, J. Matsumoto, I. Kimura, A. Yamauchi, and Y. Kataoka, “Monomeric α-synuclein induces blood–brain barrier dysfunction through activated brain pericytes releasing inflammatory mediators in vitro,” Microvascular Research, vol. 124, pp. 61-66, 2019/07/01/ 2019.
[9] J. Franco-Barraza, D. A. Beacham, M. D. Amatangelo, and E. Cukierman, “Preparation of Extracellular Matrices Produced by Cultured and Primary Fibroblasts,” Current protocols in cell biology, vol. 71, pp. 10.9.1-10.9.34, 2016.
[10] O. Török, et al., “Pericytes regulate vascular immune homeostasis in the CNS,” Proceedings of the National Academy of Sciences, vol. 118, p. e2016587118, 2021.
[11] F. Takata, et al., “Brain pericytes among cells constituting the blood-brain barrier are highly sensitive to tumor necrosis factor-α, releasing matrix metalloproteinase-9 and migrating in vitro,” J Neuroinflammation, vol. 8, p. 106, Aug 2011.
Lots of progress and nice figure set developing here.
You mention re-doing the confocal with a EC marker. While you are at it, you should stain the monocultures in confocal. I think it would be impactful to show that the pink collagen layer in Figure 3 is there when you have the pericytes alone, but not so much when you have the HCMECs alone.
We can certainly do that the next time we set up μSiM cultures.