Transmission Spectra of pnc-Si
UPDATE:
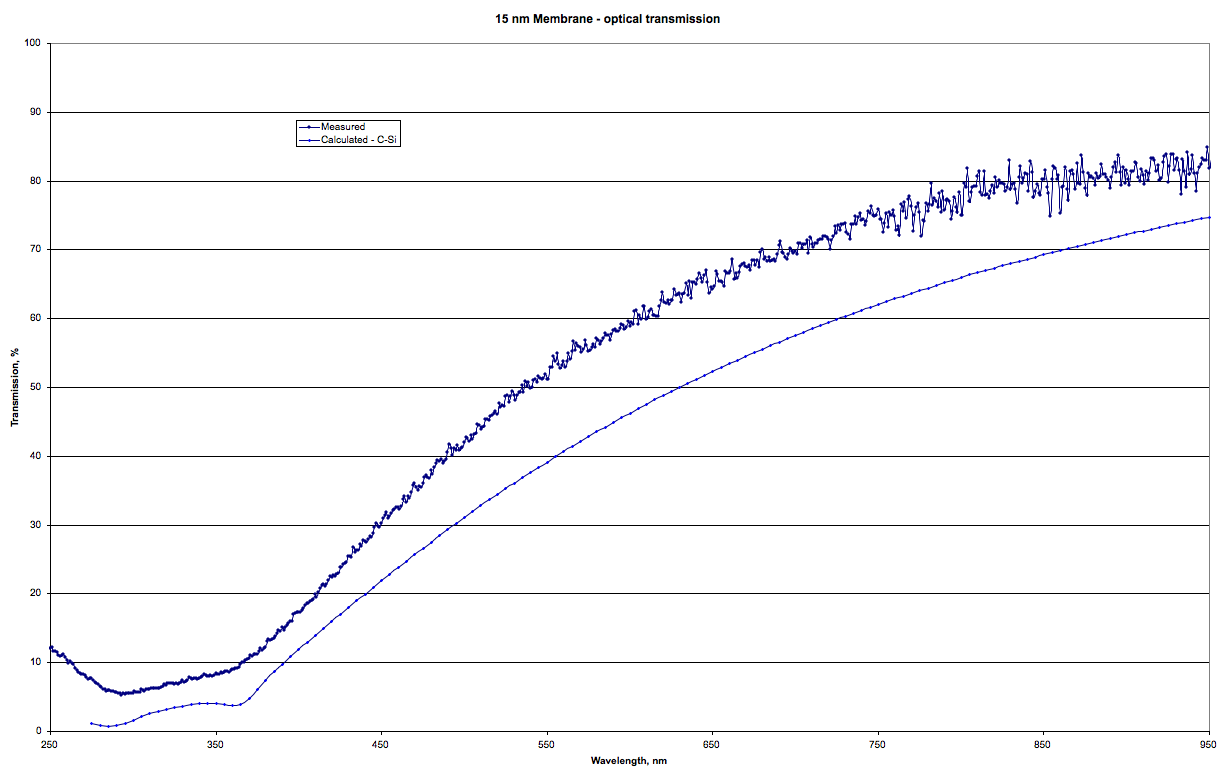
Chris took the membrane sample and normalized with by the no spanning membrane sample. This was plotted against the theoretical spectrum of single crystal silicon. The curves have a similar shape, but the single crystal silicon has lower transmission. This may be due to the fact that it’s a perfect material or that there’s error in our measurement or normalization of the pnc-Si membrane.
I took a few sample over to Dr. Tom Foster’s lab, and they had a spec that you could insert about any size sample and look at the transmission through the sample. We used membranes inserted in SepCons from w334.
Here what we looked at:
1. 3 chips with 2 slits and a membrane spanning the slits – yellow on my chart (all three samples were very similar, so I only plotted one on this chart)
2. a chip with 2 slits and no membrane spanning the slits – blue on my chart
3. beam was focused on the bulk silicon – pink on my chart

As expected there is no transmission through the bulk silicon. The chip without any membrane spanning it has a steady transmission at about 15%. It does not appear to have 100% transmission through the slits because the bulk silicon blocks a portion of the beam. The sample with a membrane deviates a good deal from the sample without a membrane at the lower wavelengths. It appears to have an absorbance peak around 270nm.
Thanks to Tom Foster and his student Soumya Mitra for these results.