Reimaging Protein Separations
Originally, I created the following figure to visualize the relationship between sieving coefficient and molecular weight:
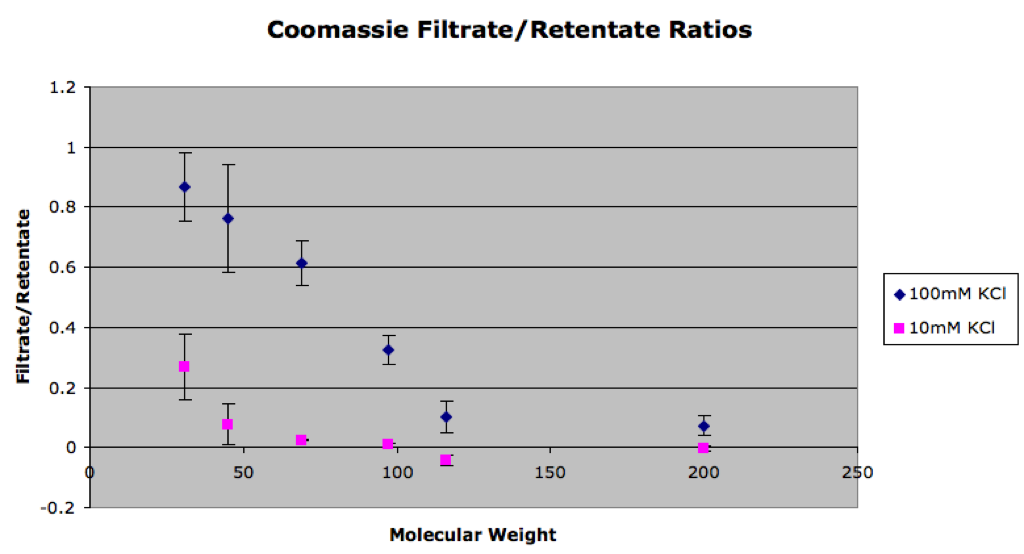
I can now take the protein dimensions that I obtained from crystal structures (posted here) and replot this figure:
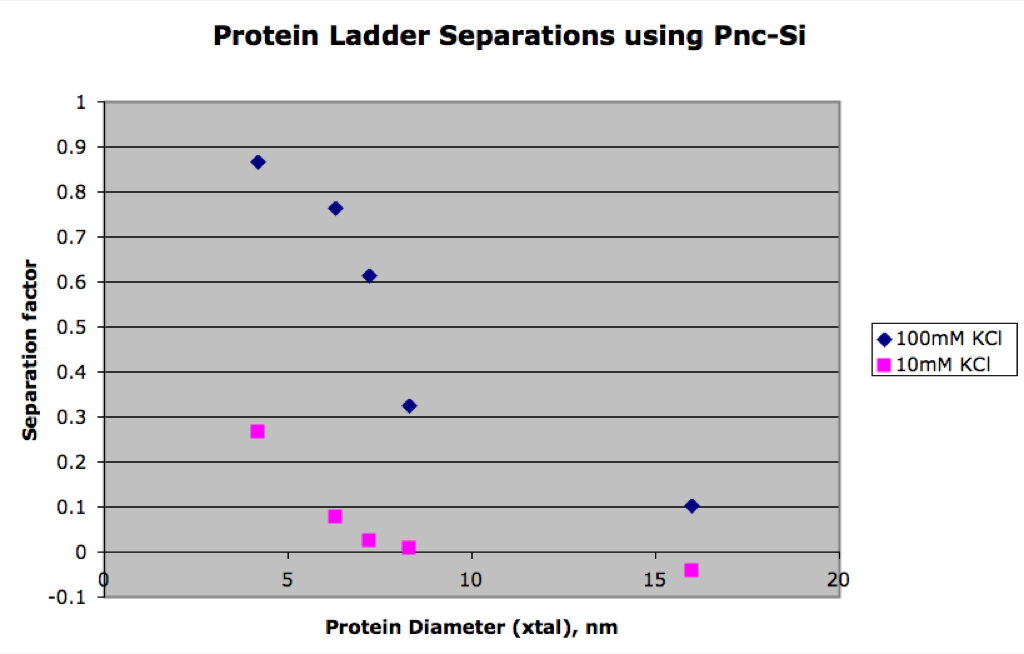
In this version of the figure the sigmoidal shape of the curve is even more obvious in the 100mM KCl sample. I then took the 100mM data and used MATLAB to perform a nonlinear regression fit:
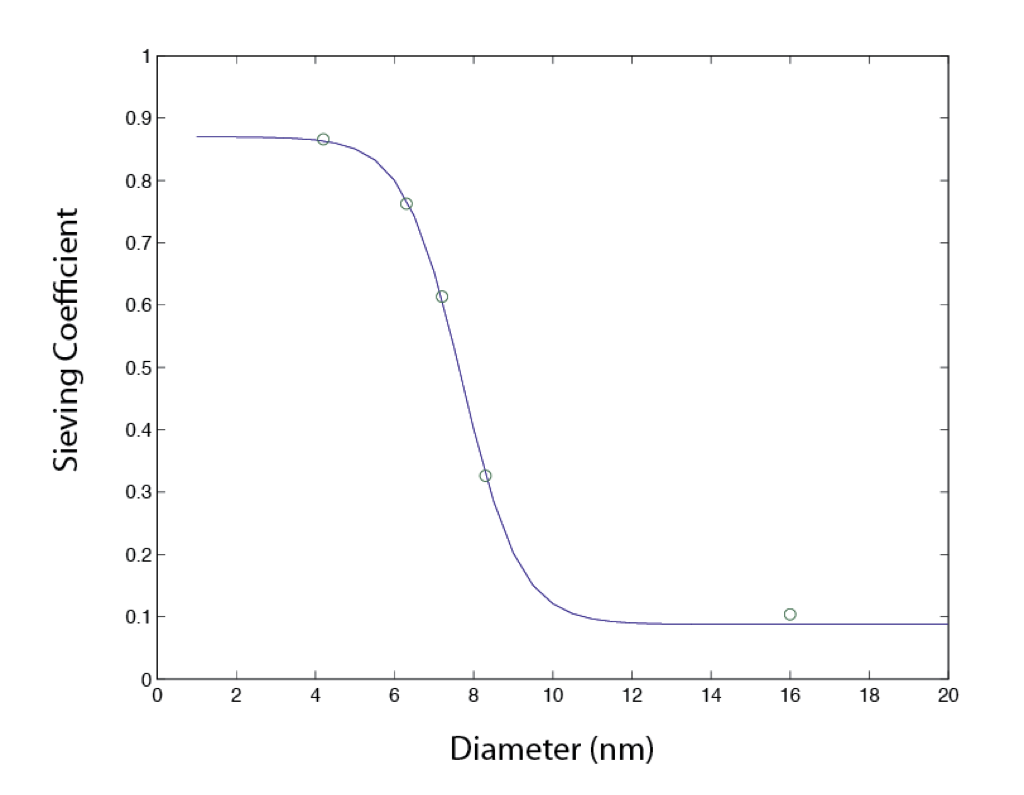
This is a little trickier with the 10mM sample as it’s not really exhibiting a plateau for the smaller proteins.
Note:I found a paper in Carlson from Separation Science and Technology (I’m going to copy and post it soon) that explains that the relationship between separation coefficient and pore diameter is related to the cummulative probability density function of the pore distribution of pores in glomerular and ultrafiltration membranes, both of which have log normal distributions. This paper also says that the sharpness of the separation can be indentified by the standard deviation as defined by the distribution.
since our pore distribution is NOT log normal, would we expect some interesting new relationship or in general anything new wrt established theory?
Exactly. I think we would see a sharper sigmoidal curve than the other membranes. I still need to work out the theory a little more on this and see if we can carve ourselves a niche in it.