Updated Water Permeability Figure
In the previous post, I used a compound error bar that took into account both image and operator variability. While that seemed to make things a little better, we were still having a problem with w705. I reprocessed a couple extra images from the TEM gallery, and added the differences to the image variability part of the error. Doing this finally gives us all overlapping error bars.
I find that there is a lot of variability in the pore processing, and I feel a little guilty that I’m adjusting the processing so that it lines up with the permeability. However, I believe the more that we compare pore processing with water permeability, we will find that it more or less lines up and that some membranes are just tough cases.
Here’s the figure:

Additional Charts:
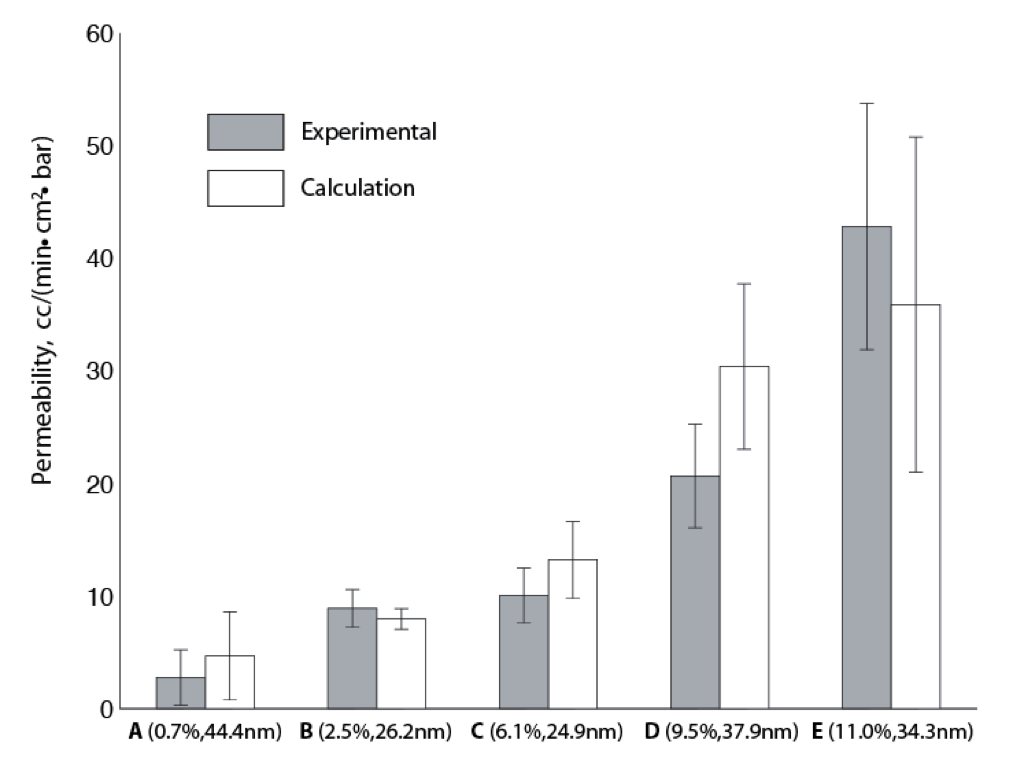
Calculated vs. Experimental Permeability

Plotting the permeabilities along with porosity (rather than just bars in a bar plot):

Updated Water Perm Fig: