New EO wafers
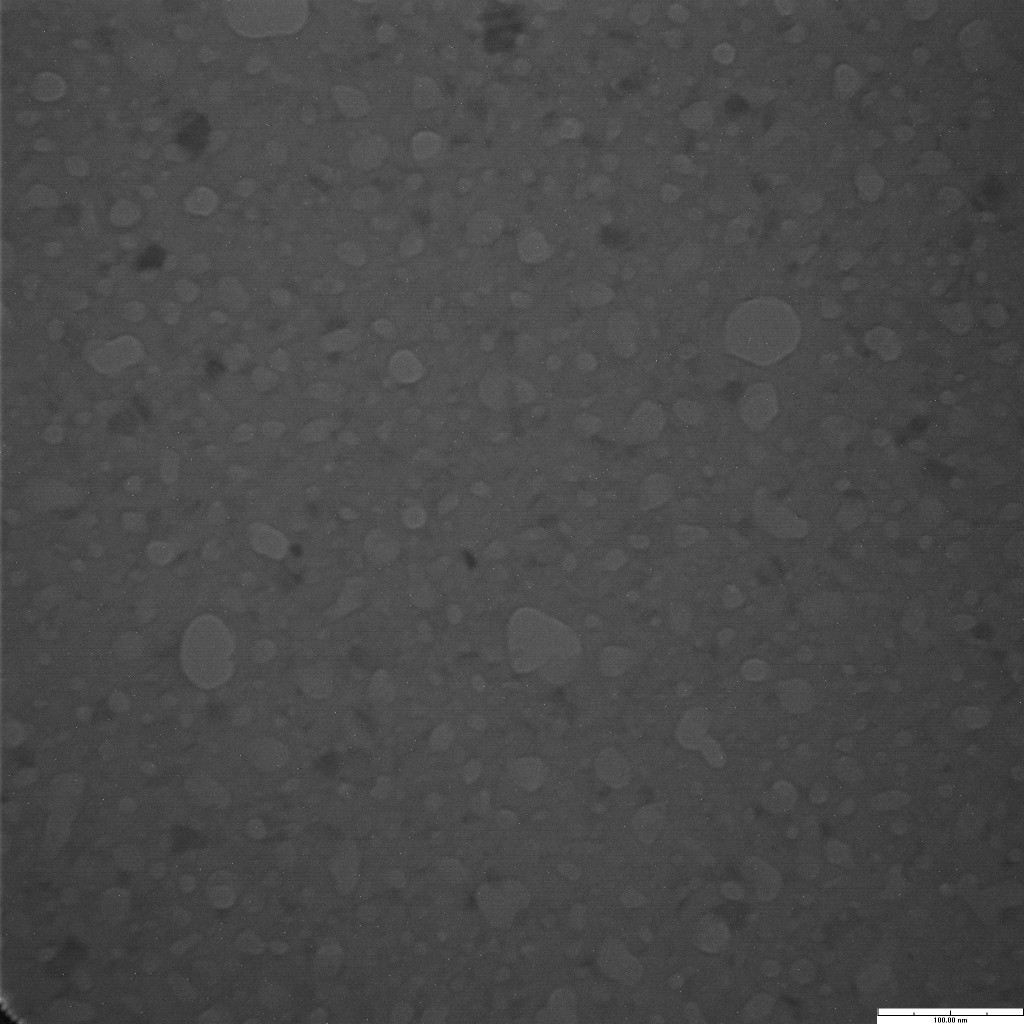
We got a bunch of extremely nice EO wafers through the pipeline, and I’ve been trying to do some experiments with them. There’s very few pinholes on these wafers, and the pores are beautiful. My experiments so far have been w/ SC 166.
Pore image:

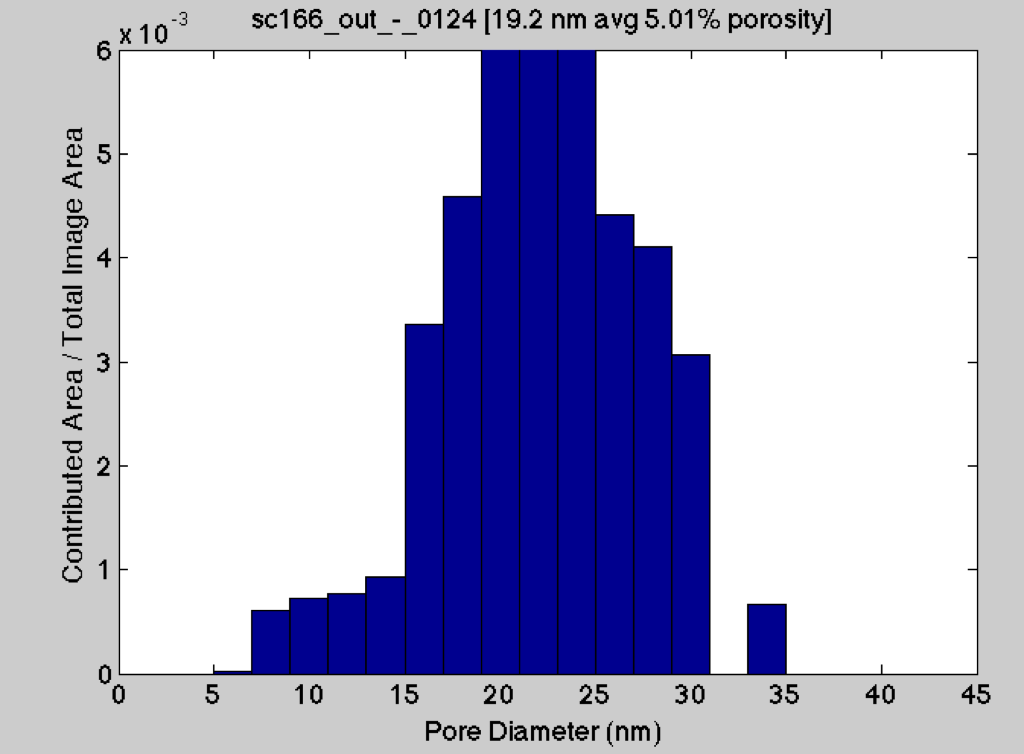
Contributed area distribution:
We need the following figures for our EO paper:
1. Active area vs. EO rate
2. Oxidized vs. non oxidized
3. Voltage dependance
I started out testing a set of unoxidized membranes from this wafer. All chips (4 repeats) had 6 small squares (.06 mm2 active area).

Fitting a trendline to this data gives an EO rate of 2.8 uL/min. We can compare this to the old EO vs active area chart:

Our rate is almost 2x higher than the old rates in this chart, and the old samples in this chart were even oxidized. The three bottom points were from w13, and the best image we have of this wafer is the following:
I don’t think many of these pores go through, so we may be looking at a porosity/pore size difference with these samples. Course it’s pretty hard to tell.
The next step was to try and oxidize some samples to do the comparison and start on the active area plot. I first cleaned the chamber (15 min, 150C, vacuum on) and then ran the samples at elevated temp for 15 min. None of these samples were able to perform electroosmosis. There was current through the membrane, so the windows were not blocked. Windows appeared to be intact after the experiment. There was just no change in fluid levels over 30 min.
Contact angle to start with was very low on this chip. After oxidation, it seemed to be similar or a little lower. Here’s a rough image:

I then went on to try 1x square chips from this wafer, unoxidized, and at the same voltage. Initial rates of electroosmosis were the same as the 6x chips above until 10min, then the flow completely stopped. On dissasembly, I noticed the chips had been discolored:
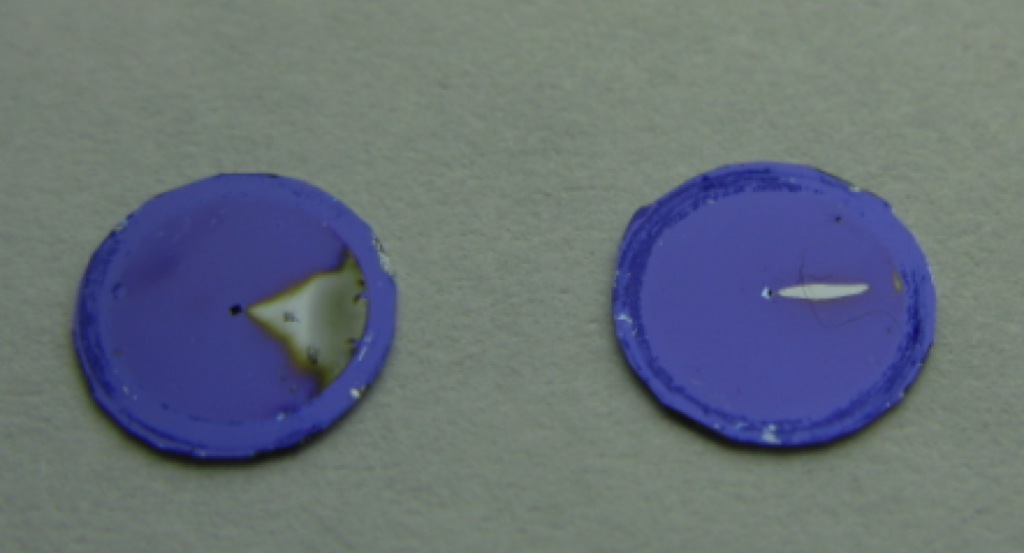
I’m getting this wafer RTP’ed to see if this improves EO longevity. It is interesting to notice that the smaller active area chips were more affected than the larger – maybe this has something to do with the field? It is also a curious pattern of discoloration.
The results on the native material look very good.
Is the elimination of the EO effect reproducible or was it just seen in one sample? There’s something strange going on with the ozone system, so I don’t trust it very much. It seems odd that the contact angle would drop, yet EO would stop.
I tried 2 oxidized samples and neither had any flow rate.
Nakul was telling me he was getting contact angles to drop yesterday, so maybe I need to check my method for purging the system before oxidation.
I’ve also noticed that the O2 hooked up to the ozone generator is industrial grade. We originally set it up with an ultra-high purity (UHP) grade so I’m not sure when the switch was made. The impurities in the industrial grade may be affecting the treated surfaces…
I know that the chamber is not under vacuum so there’s bound to be other gases inside but a long enough flush with pure O2 and keeping positive pressure should minimize the impurities.