Flux in membrane simulations
In this post I take a look at the flux of molecules through the 1-D membrane simulations. I will then use this flux to compare to systems lacking a membrane.
First off, how to find the flux. Inside the membrane, the Flux = -Dm dc/dx. Unfortunately this is extremely hard to calculate because of the infinitesimal thickness of the membrane in the 1-D equations. To get around this, we can take the approximation that in the absence of adsorption, the flux going into the membrane equals that within the membrane, or
F = -D0 dc/dx.
Therefore, to find the flux, we take the slope of the concentration profile just outside of the membrane and multiply it by the free diffusion coefficient.
The best way to talk about my results is to show the following example situation:
Separation time = 1 hour
Molecule sizes .5 – 20 nm
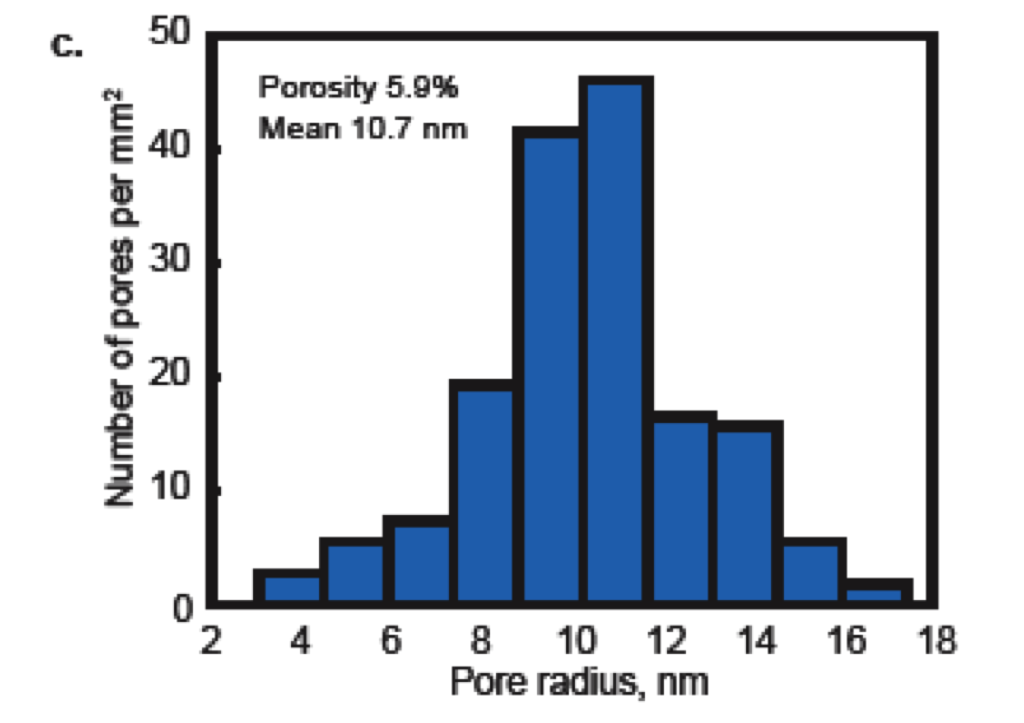
Pore distribution = SC 169
First I looked at the slope of the concentration profiles just before the pores:

Small molecules are almost to equilibrium, thus the very small concentration gradient. As the size increases, the system is further from equilibrium and dc/dx increases (negatively). At about 10 nm, the pores start to really affect the separation, and dc/dx drops quickly to zero as the molecules are hindered more and more by the membrane.
Next I looked at the flux:
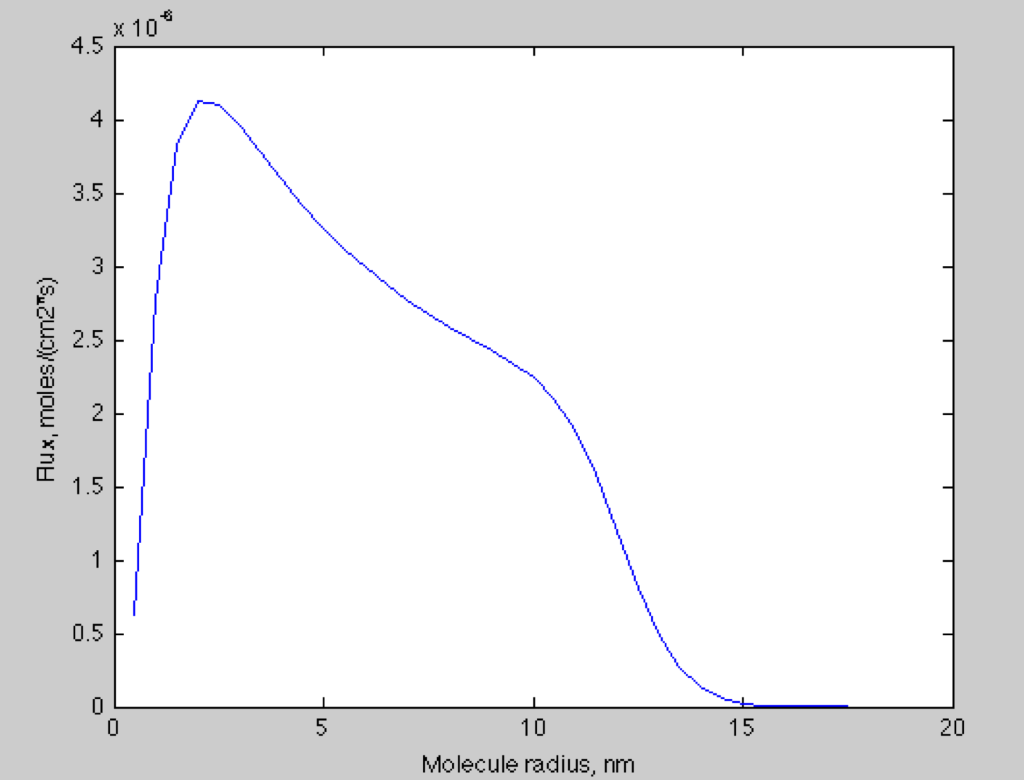
The flux starts out low because the early systems are at equilibrium, then quickly increase until the molecule is about 2nm. The flux then starts to drop even though the concentration gradient is still increasing for these molecules. I believe this is because the larger molecules diffuse slower. The flux continues to decrease, and then really drops when it hits the place where the membrane begins to affect the separation.
Now we can compare this to the no membrane case. Here is the concentration gradient at a position just before where the membrane would be:

The similarities between this image and the membrane concentration gradients emphasizes the fact that the membrane only begins to affect the separation around 10 nm.
Now for the no membrane flux:
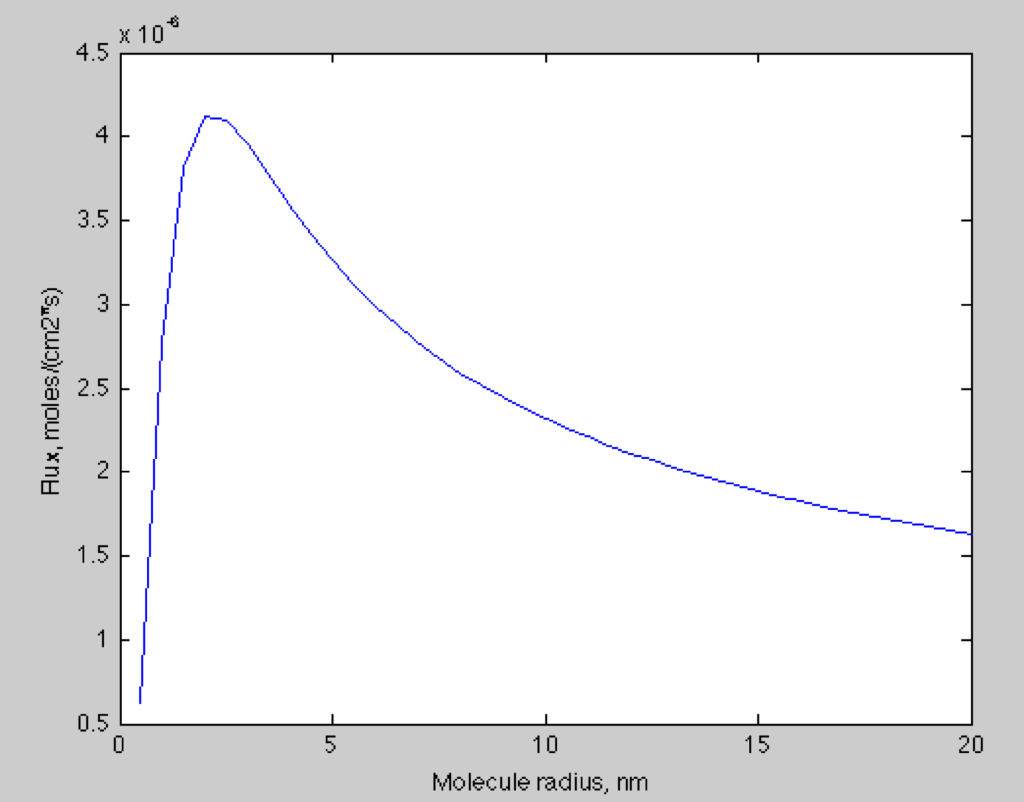
The flux decreases slowly here after 2nm due to the decreasing diffusion coefficients of the molecules.
We can take a ratio of membrane flux/no membrane flux:
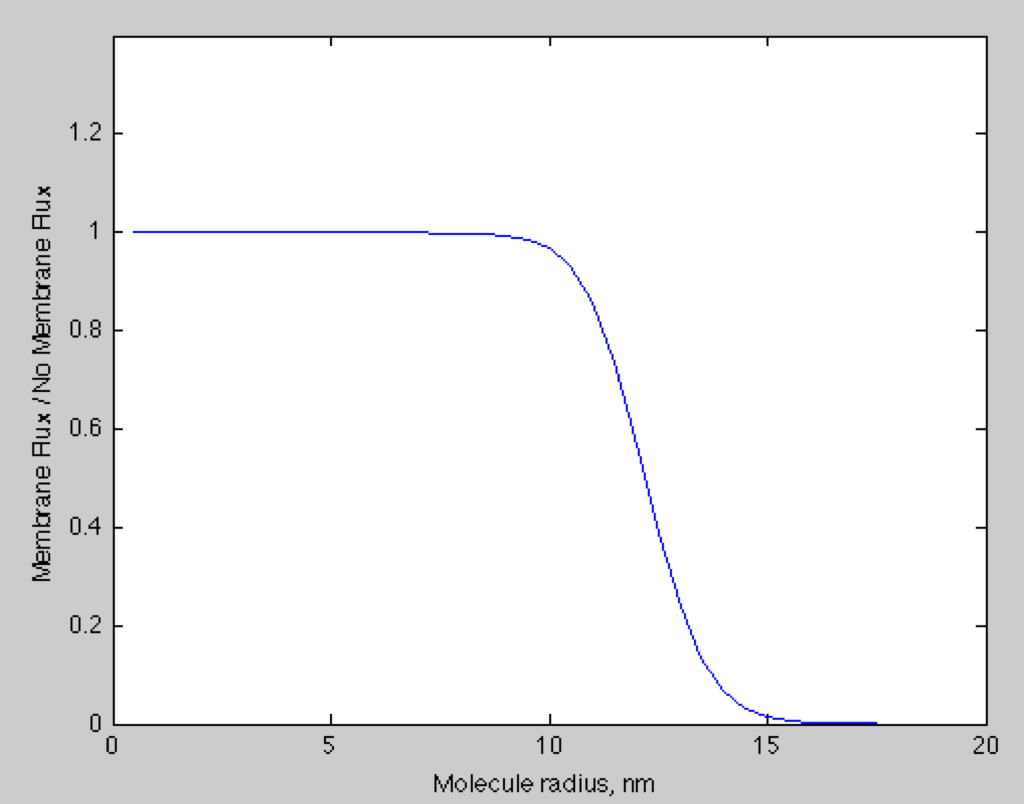
Next up I’ll try to use this analysis to find membrane impact. It seems a little more intuitive than the effective diffusion method discussed earlier.