Looking at membrane impact with flux
In the previous post, I discussed how we could evaluate the flux of molecules through the membrane and alluded that this method could be used similarly to our effective diffusion coefficient manner of evaluating membrane impact. Here are results of the full comparison.
Standard setup: 15nm membrane, 1 hour time point, 1mm fluid wells, 5% porosity, 10nm monodisperse pores
Parameters such as time, porosity, thickness, and fluid well length change the normalized flux in the following manner:
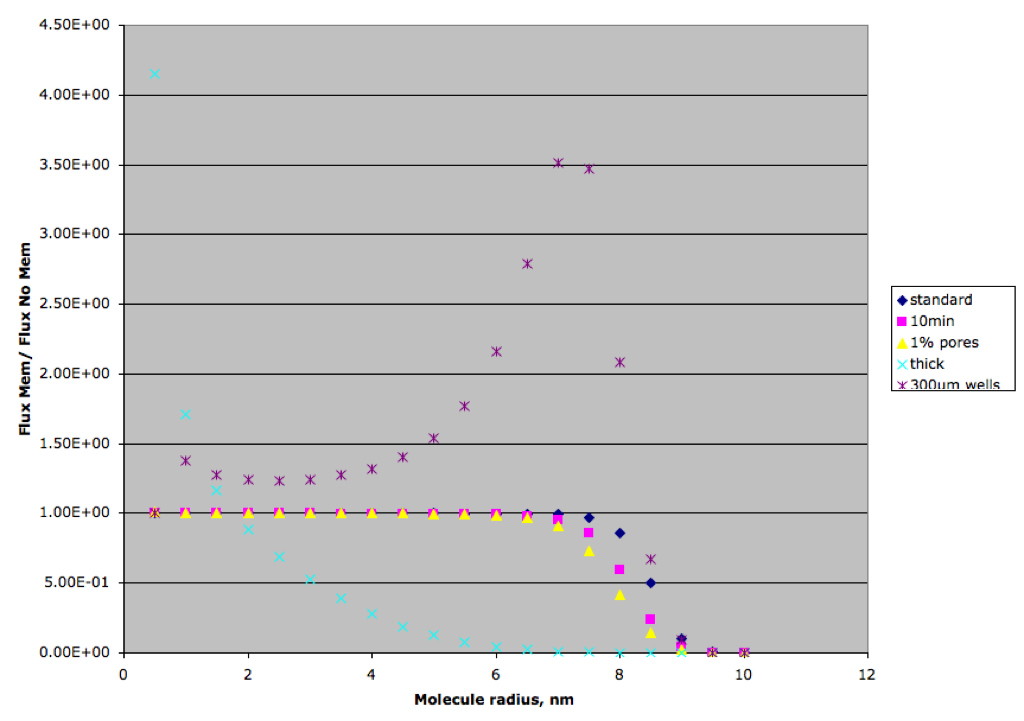
This chart doesn’t look exactly as we would expect, but there’s a few things similar to previous versions. The relationship between the standard separations, the 10 min separation, and 1% pores is similar to the previous Deff charts. This shows that the membrane effects the flux of a larger range of molecules in these situations.
The thick membrane and smaller 300um wells is surprisingly different than before. This is because large differences between the separation profiles in the membrane and no membrane separations drastically affect the flux. For example, in the no membrane case, a .5 nm molecule is close to equilibrium and has a very low flux. The same .5 nm molecule is much further from equilibrium in the thick separation and has a higher concentration gradient and thus higher flux. This is why the normalized flux is larger than 1.
The same goes for the small well separations. The membrane has large affect on the separation and the flux is higher than the no membrane separation. The normalized flux here is increasing because the membrane separation gets further and further from equilibrium when the no membrane separation remains very close to equilibrium. The correct way to compare all these separations is to find a point when these transient differences don’t have much of an effect.
The Deff and sieving coefficient versions of these charts didn’t have these problems because they were based off total concentration.
For a specific time point, this graph seems to make sense. However, I think the better metric would be the integral of the flux over time (quantity transported across the membrane), as this would get rid of the artifacts that are causing the issue here.
Depending on your purpose, you may also want to try plotting something that would indicate how close to equilibrium each size species is. Or better yet, a time independent quantity like “time to reach 90% of equilibrium concentration” for each molecular size, taking the ratio of the no/membrane values. This would probably be the most practical metric of membrane hindrance, since the objective of diffusive separation is to get as close to equilibrium, as quickly as possible.