CytoVu FLAG Separations
Since the basic protein diffusion experiments went well, I’m moving up to something that more closely resembles an actual assay application. The basic idea is this: Biotin-conjugate FLAG antibody will be bound to Avidin acrylic beads in order to make them far too large to pass through the MP8NP50 membrane. Then, Bacterial Alkaline Phosphatase (bAP) will be added to the solution where it will bind to the antibody. bAP is small enough to diffuse through the membrane, but with the Antibody restraining it, it should not enter the filtrate in any real quantity.
Finally, an elution will be performed by adding FLAG Peptide to the solution, competing with the bAP for the antibody binding sites and freeing the bAP to diffuse through the membrane. I assume that due to the much higher affinity of Anti-FLAG for FLAG peptides, the addition of peptide should cause the binding sites to strongly favor peptide binding, thus reducing the number of binding sites available to the protein and shifting the equilibrium towards more protein free in solution, leaving it free to diffuse into the filtrate.
The following spreadsheet lays out the details of the experiment and depicts each individual test:
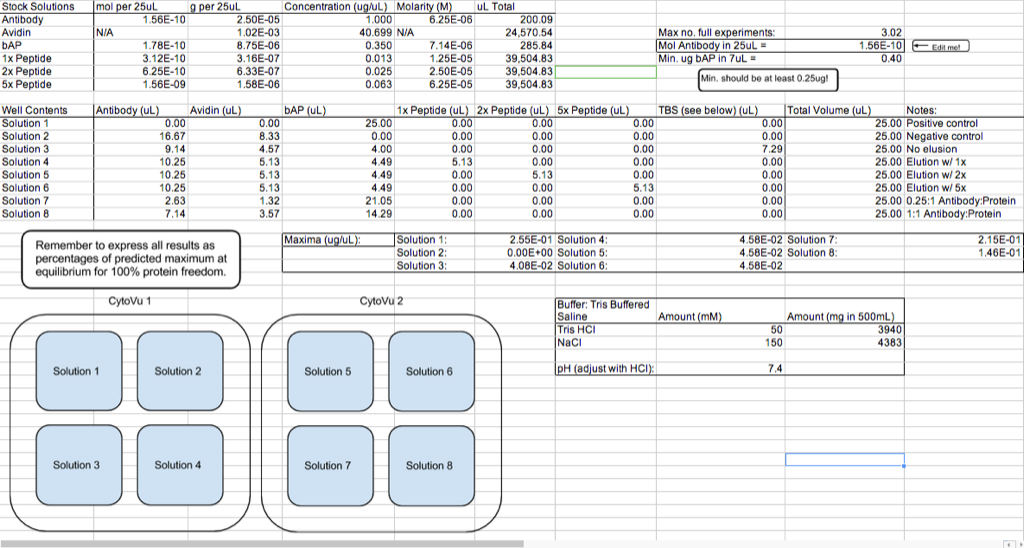
I plan to quantify the amount of protein in the filtrate using an Invitrogen Quant-iT protein assay kit. Quant-iT is a molecule which fluoresces when it binds to another molecule — in this case, a protein. The amount of fluorescence can be measured by the TECAN, and when plotted against a standard curve, the fluorescence data for an unknown sample can be used to determine the concentration of protein in that solution.
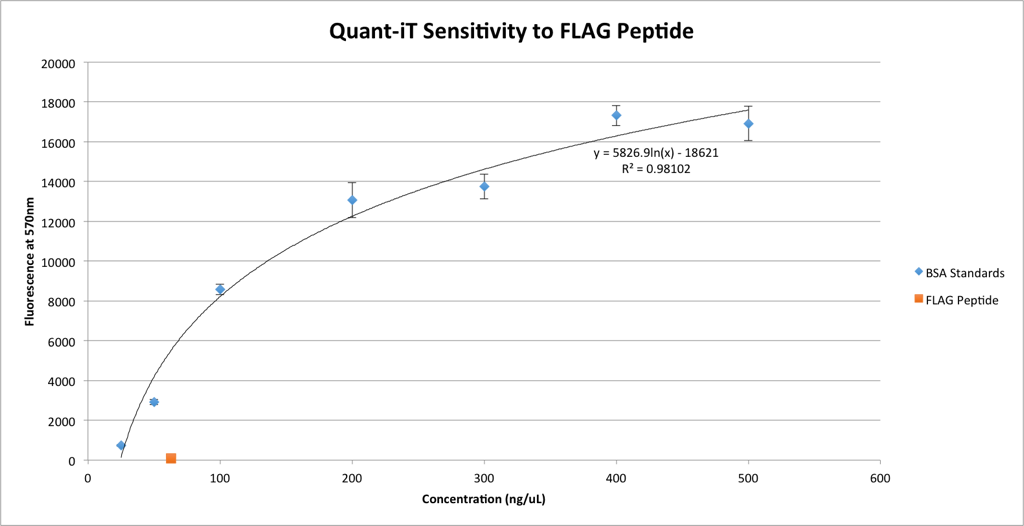
One of the preliminary steps before the actual diffusion experiments is to ensure that the measurements are reliable. I need to be sure that the only molecule in the filtrate that’s causing the Quant-iT to fluoresce is the bAP, otherwise the numbers are meaningless. Jim quite helpfully pointed out that the FLAG Peptide is definitely small enough to enter the filtrate, and since it’s in essence a very simple protein, it might react with Quant-iT. To make sure this is not the case, I’ve run an assay with a large concentration of peptide.

Good news! The peptide, if it reacts with Quant-iT at all, has a negligible effect on fluorescence. The concentration of peptide used here (63 ng/uL) is considerably higher than any concentration I would expect to see in the filtrates of the actual experiments, because this concentration is the highest I will be using and even if none of the peptide binds to the antibody, the concentration will be cut by diffusion from the retentate into the filtrate. Thus, I feel comfortable saying that the peptide will not interfere with the results of the Quant-iT assay.
As Jim pointed out in a comment below, this protein assay doesn’t appear linear. I had expected a linear fit because of Invitrogen’s own claims regarding their assay. Since I used 10uL of each of the BSA standards, every point on that graph excluding the zero point, should be in the linear range of a Quant-iT protein assay. Instead, by dropping the zero point, we see a definitive logarithmic curve to the data:
I have no explanation to offer. This is at direct odds with Invitrogen’s report, so I don’t know what to believe. I expect I’ll be running a few more assays to determine if this is repeatable.
UPDATE: Dear diary,
Today the universe played a joke on me.
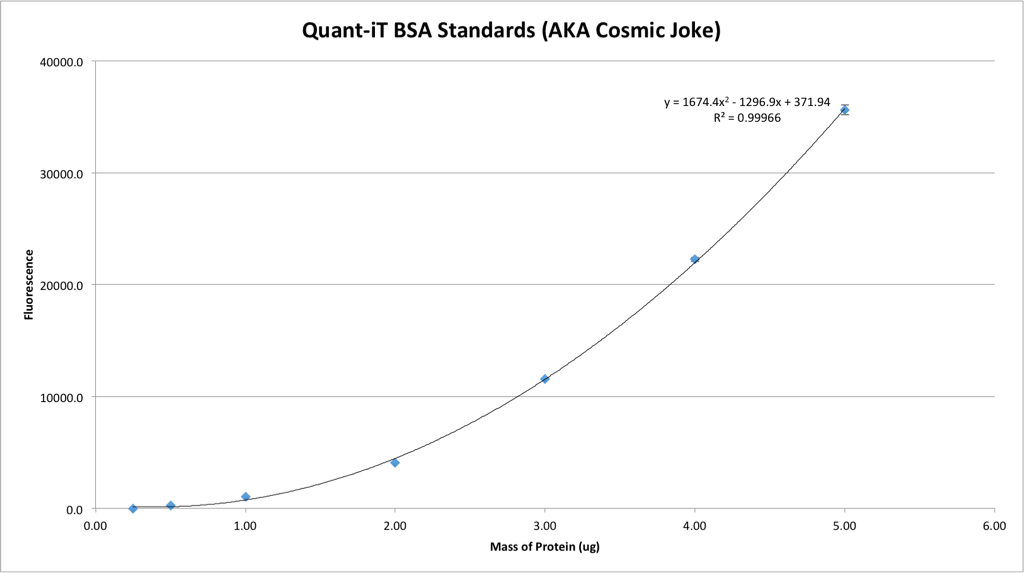
… Guess I’ll do it again, again.
UPDATE 2: This time, I allowed the reaction buffer to equilibrate more closely to room temperature, out of a suspicion that the temperature might have a bigger effect than I previously had though. Now it looks considerably more like Invitrogen’s sample curves, so I suppose this is the most accurate standard curve I’ve yet produced:
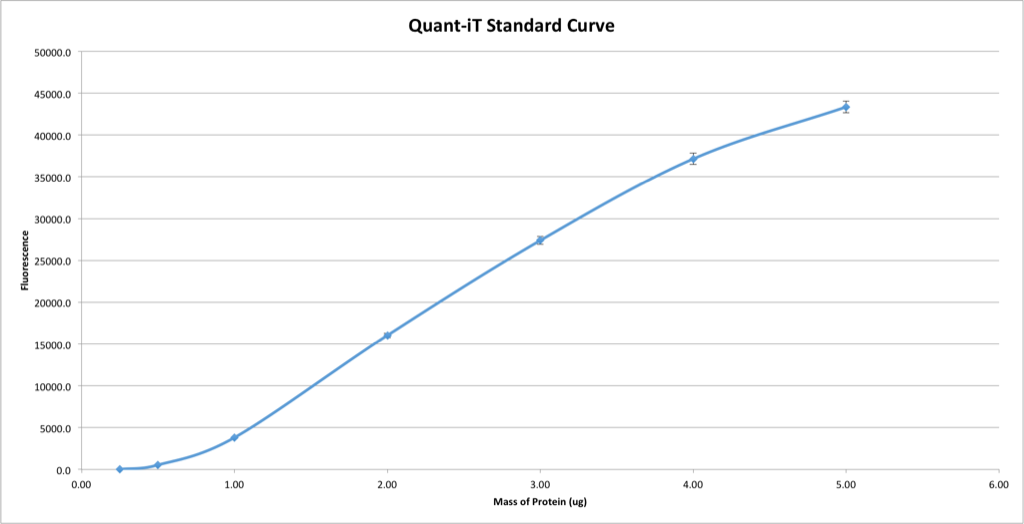
I suppose it would be fair game, then, to fit a high-order polynomial to the graph such that the resulting equation almost perfectly represents the shape of the standard curve. Technically Invitrogen only says that the assay is sensitive between 0.25ug and 5ug, not linearly sensitive, so perhaps this is the correct way of going about things.
In any event, it seems that the FLAG separation experiment is poorly designed. Working with such minuscule volumes and high concentrations leaves an enormous room for error, and still only barely results in enough bAP to be within range of the Quant-iT assay. I attempted the experiment as I laid it out above, but the results were utterly nonsensical; The negative control, which had no protein, appeared to contain greater-than-error amounts of protein, and the elution samples showed absolutely no trend, with the 5x elution resulting in the smallest amount, the 2x the largest, and the 1x in between. In other words, complete poppycock.
In an attempt to make the experiment more workable, Jamie and I are discussing ideas for instead testing for bAP concentration using enzymatic activity assays, which are much more sensitive (one I found can detect sub-picogram amounts of enzyme) and thus will allow for much more dilute stock solutions and, in turn, higher volumes, decreasing the margin of error. Due to the amount of new information to convey regarding this change in experimental design, I’ll probably be making a new post when the design is decided upon.
From your post it is unclear why the FLAG peptide will displace the enzyme from the antibody/bead complex. You missed a key part of the description.
Notice the linear regime in the Quat-it assay. Both the high end and low end look non-linear. You should report the range of concentrations for which this assay is linear.
I said that the peptide will compete with the protein for antibody binding sites. I assume that due to the much higher affinity of Anti-FLAG for FLAG peptides, the addition of peptide should cause the binding sites to strongly favor peptide binding, thus reducing the number of binding sites available to the protein and shifting the equilibrium towards more protein free in solution and leaving it free to diffuse into the filtrate. I’ll update the post to include that, but frankly this was never explained to me either — I’ve just been told that the elution should happen.
As for the linearity of the Quant-iT assay, I reported what I did because those BSA standards are a part of the assay kit. According to Invitrogen, the assay is linear from at least 0.25ug of protein to 5ug. (See: https://tools.invitrogen.com/content/sfs/gallery/high/Q33210_080814.jpg) These standard solutions were all used in quantities of 10uL, so with the exception of the 0ng/uL case (which is important for it’s own reason) all of these values should be in range.
I’m honestly not sure why it didn’t come out that way. I tried fitting a line to the graph, but it didn’t seem relevant since I didn’t use it. The Rsquared was roughly 0.88, so perhaps it’s not as bad as it looks. Interestingly, if I drop the zero point, these values very cleanly fit a logarithmic regression… Picture: http://i.imgur.com/OsLQb1N.png
Now I don’t know who to trust, Invitrogen or the data. I suppose I should run more tests to be sure this isn’t coincidental. I’ll update the post to mention this.
Thanks for your help, as always!