Modeling EOF and Electric Field Gradient at a Microporous Membrane
I used COMSOL for finite element analysis (FEA) modeling of EOF and DEP at a microporous membrane in a PDMS microfluidic channel. Effects of two parameters were determined: Membrane thickness, and spacing between pores. The modeled membranes had a 25×25 um surface, and a thickness of either 100 nm or 500 nm. Pore diameter was 3 um, and pores were distributed in a honeycomb pattern (Figure 1), with diagonal spacing between pores either 6 um or 9 um center-to-center. Zeta potentials were -13 mV for PDMS (experimental values from our lab) and -30 mV for SiN. 100 V/cm electric field was applied across the modeled microchannel. I made sure that the mesh was fine enough to capture gradients across the membrane in all three dimensions. The 25×25 um surface area was selected to limit computational load. Figure 2 shows log10(grad(E)2) values 1 um upstream of the membrane surface.
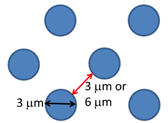 Figure 1: Pore configuration
FEA models showed that a thicker membrane will result in a slightly higher volumetric flow rate from EOF. Closely packed pores will also result in a higher volumetric flow rate. Both of these results were expected. Thicker membranes have larger pore surface areas, where EOF force is generated, while higher pore density means larger cross sectional area for fluid to flow through (and more total pore surface area). EOF velocities of 61-83 mm/s were predicted for the conditions described above. In a control model, we set the zeta potential of the SiN surfaces to be the same as that of the PDMS walls (-13 mV), and saw a decrease in EOF rate. EOF would be even slower with no membrane (or zeta potential of 0 mV). This shows that the SiN membrane has a significant contribution to EOF.
DEP results are given in terms of grad(E)2, which is the only variable which affects the DEP force that is independent of particle and medium conditions, and therefore predictive for all particles and suspension media. To make visualization easier, log10(grad(E)2) were plotted. Each unit value difference in Figure 2 represents an order of magnitude difference in local grad(E)2 andDEP force. The model clearly showed that membranes with pores spaced 6 um center-to-center had greater and more uniformly distributed grad(E)2 values compared to membranes with 6 um center-to-center pore spacing. In addition, thinner membranes showed larger grad(E)2 values. Predicted electric field gradients, and thus comparable DEP forces, are comparable to those from simulations of experiments we have previously conducted in conventional iDEP devices, where particles down to 500 nm were successfully manipulated.
 Figure 2: Logarithmic plot of electric field values (V2/m3) 1 um upstream of the membrane surface. Average EOF velocities were calculated over the entire cross section 1 mm upstream of the membrane surface. Flow is towards the screen.
This is really important work for several applications. For example, understanding the electric field strength in pores is important for us to determine the feasibility of using the membranes as enhanced Raman or fluorescence sensors.
Can provide a cross section of the the fields (electric and fluid flow)in the pores for the cases shown above?