Separations with NPN at varied concentrations
We are carrying out filtrations using wafer 1085. We are testing the total volume of filtrate that passes in a given time. We expect the total filtrate volume to decrease as concentration increases due to more immediate clogging. Ultimately, we want to show that we can get higher total volumes of filtrate in the reverse centrifuge setup.
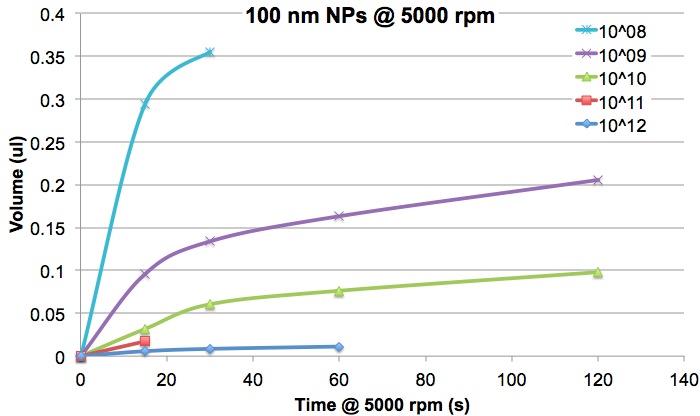
Karl and I started with 100 nm NPs from 10^8 to 10^12 particles/mL. The early terminated lines indicate broken membranes. (or at lower concentrations it means the total volume has passed through the filter)
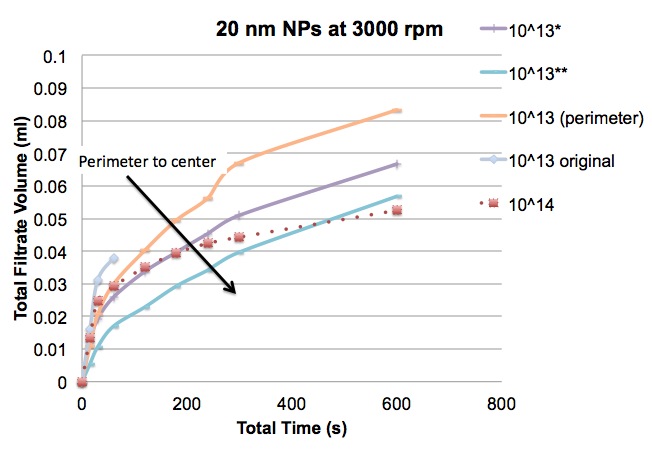
Next we tried 20 nm NPs at 3000 rpms because we were having a lot of broken chips at 5000 rpms. Again, the trend is as expected. The only problem we had with this series was the broken filter for 10^13. I tried redoing it and my attempts are summarized in the next plot.

So in this plot my first attempt to filter 10^13 “conflicted” with the results from 10^14. I tried a few more and I believe we are seeing the difference in porosity vs wafer location have an effect on the flow rates, as expected. I had noted the location of all of the chips we used in this series of experiments and it came in quite handy.
So in this next plot I redid the top three concentrations using all chips from the center and the trends line up pretty nicely. Also plotted here are the results of doing one spin at 3000 rpm for 10 minutes without stopping at the intervals used above. There is not perfect agreement, but the trends are still there.

Finally, we filtered different concentrations of IgG with similarly positive results.

We are currently working to get comparable data using reverse centrifugation, but we are having a much more difficult time getting consistent results.