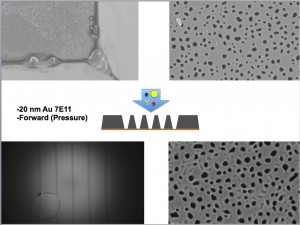
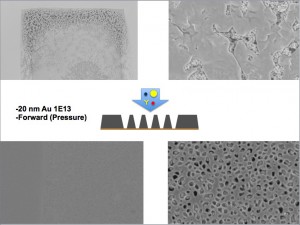
More SEMs of NPN membranes post filtration
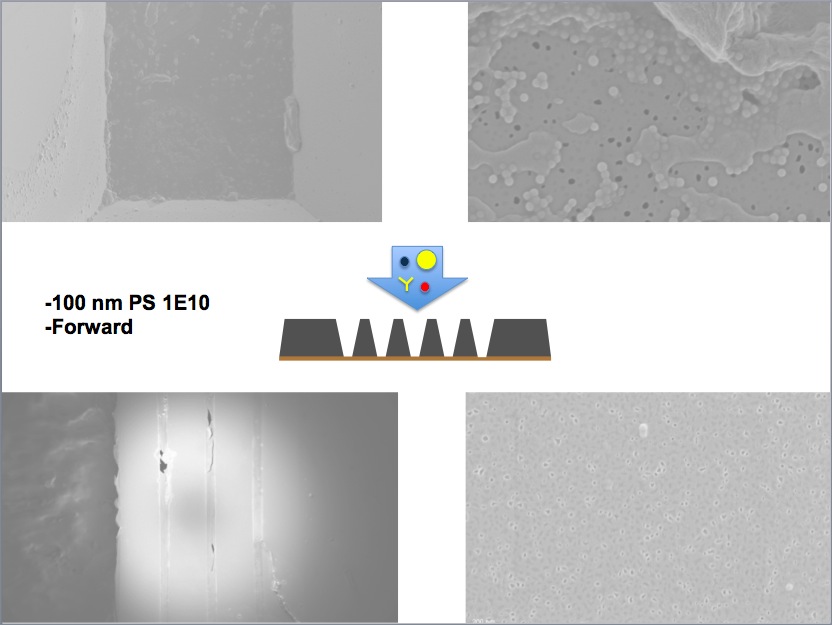
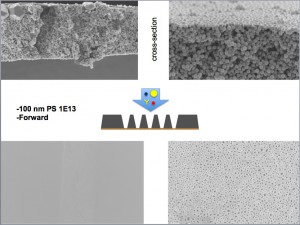
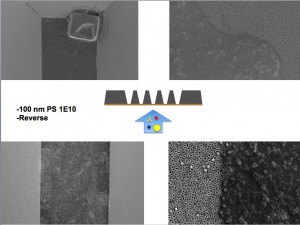
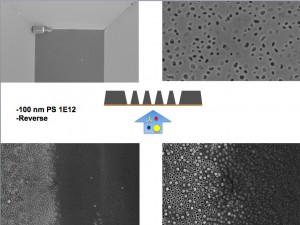
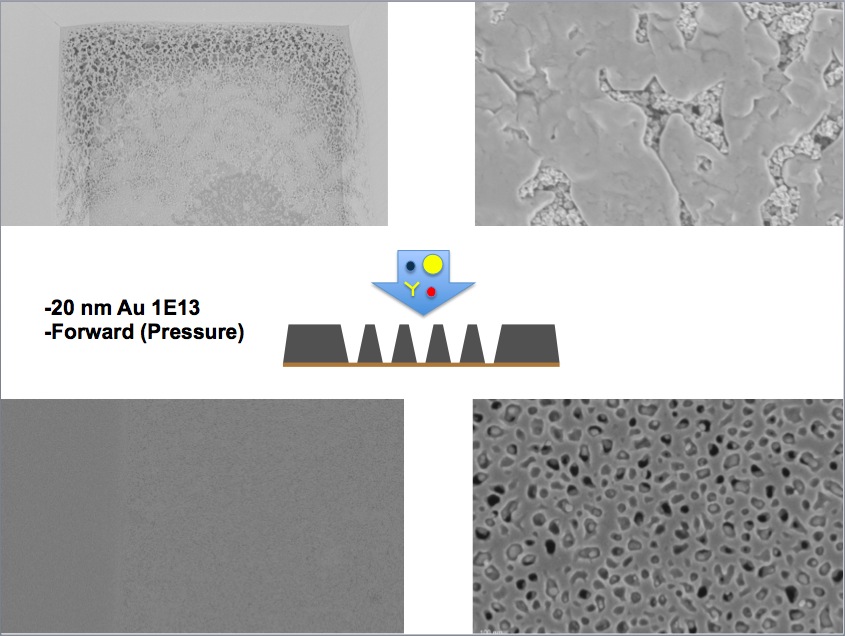
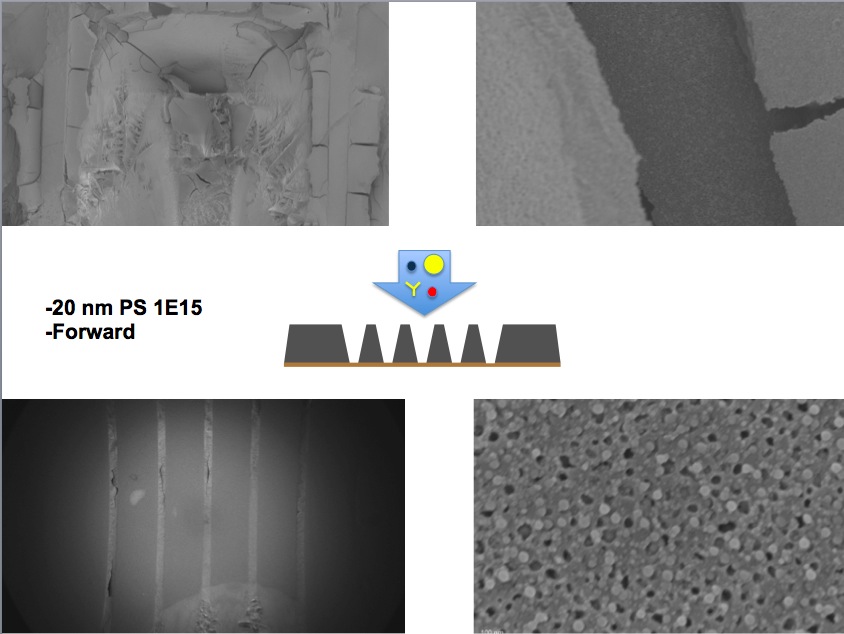
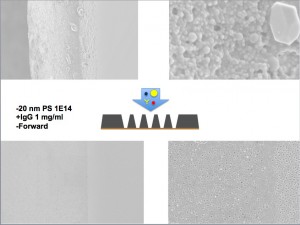
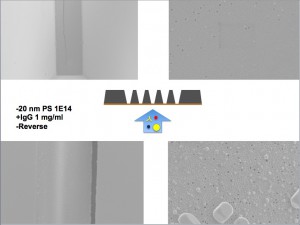
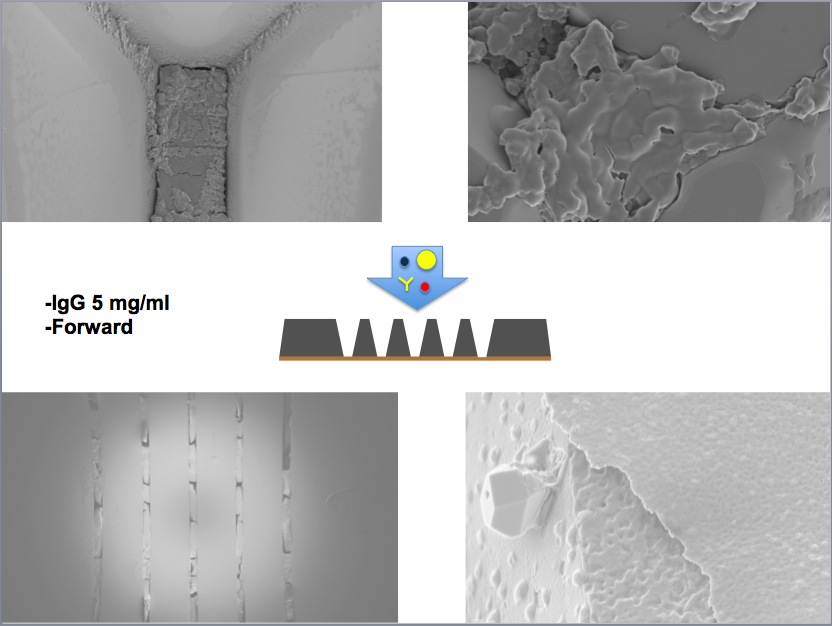
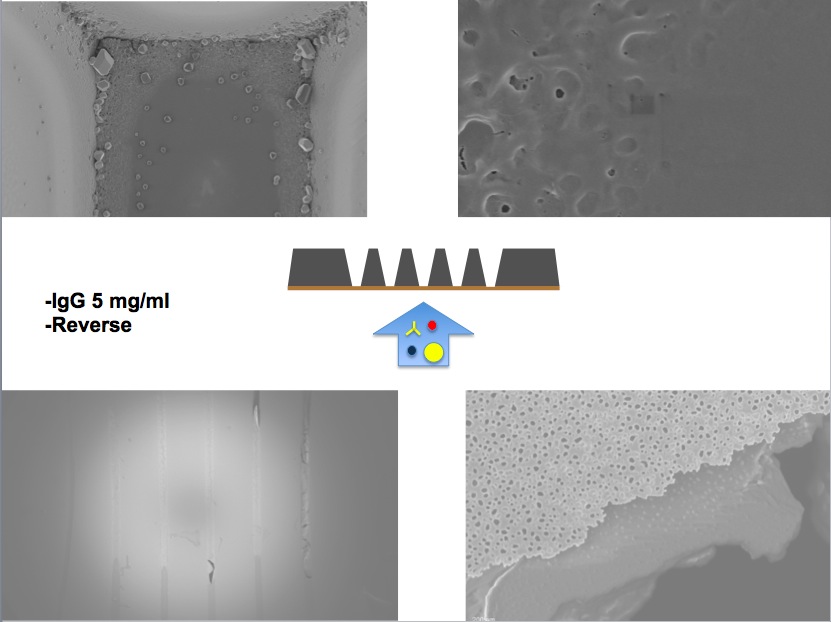
In this post I’m trying to give a better comparison among filtrations using chips from wafer 1085 using 20 and 100 nm fluorospheres, IgG, and 5 and 20 nm Au NPs. In each slide I try to indicate the flow direction with respect to the membrane. Unless I’ve written “Pressure” near the direction the separations were performed using the angled rotor centrifuge at 3000 rpm. The left side of the slides are typically lower magnification images and the right side shows the pores or is a closeup of the material I saw blocking them.
For a more comprehensive list of SEMs you can look in owncloud here:
This is a qualitative metric and I was not always consistent in sample prep. If we see a buildup of material where one would not expect it, it is possible the particles accumulated there after the residual liquid on the chip dried.
Whenever I could , I tried to simply pipette off and liquid on the chip so that the volume that needed to evaporate was minimal. Also, I did not rinse the samples because I did not want to disturb any cake layer that may have formed. It is probably worth investigating the ideal preparation for SEMs further.
I noticed some material that binds some of the polystyrene beads together and I do not know what it is. It could be the water we used to dilute the samples, or something in the stock solution.