Pnc-Si Membrane as a Flow Sensor
A change in open-circuit potential, measured across a pnc-Si membrane, in response to a fluctuation in flow rate of electrolyte solution exhibits a promising flow-sensing capability of the membrane. To demonstrate this correlation, the open-circuit potentials were measured under a variety of pressured-driven flow patterns.
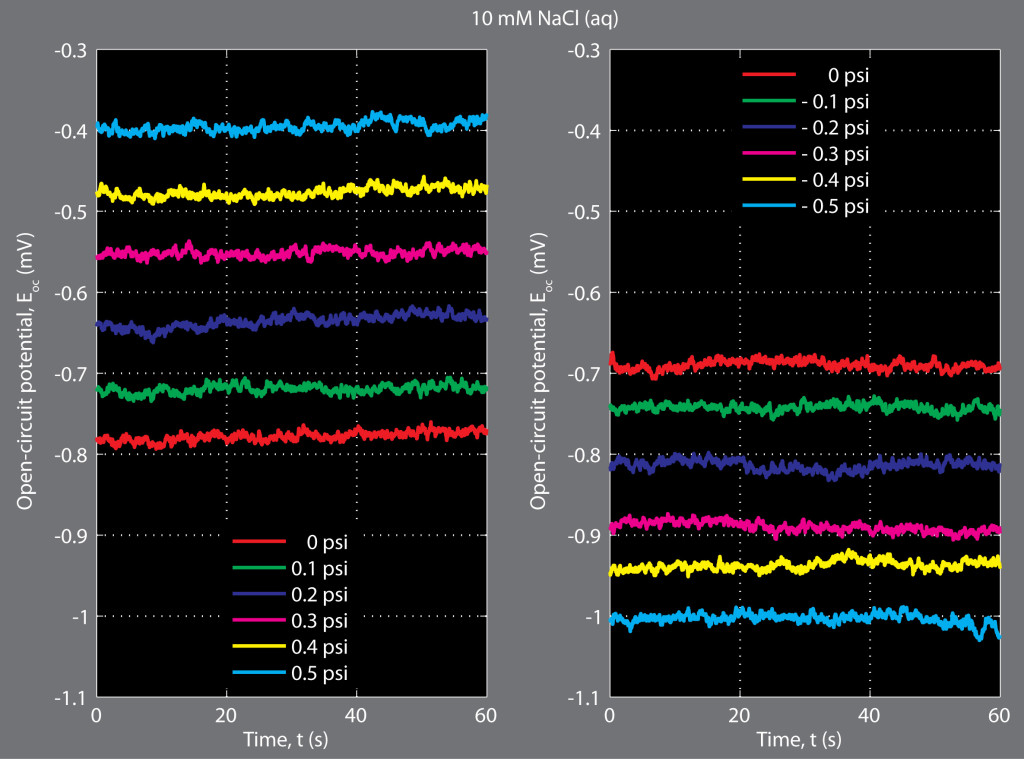
In Figure 1, a series of flows under various applied pressures were tested. The measured open-circuit potential showed a constant transient response for the entire duration of applying a constant pressure; the higher the applied pressure, the more the open-circuit potential increased beyond its baseline value at stagnation, and vice versa.
In Figure 2, a continuous flow driven by the applied pressure steps was tested. The measurement data showed a similar step-like pattern as the applied pressure.
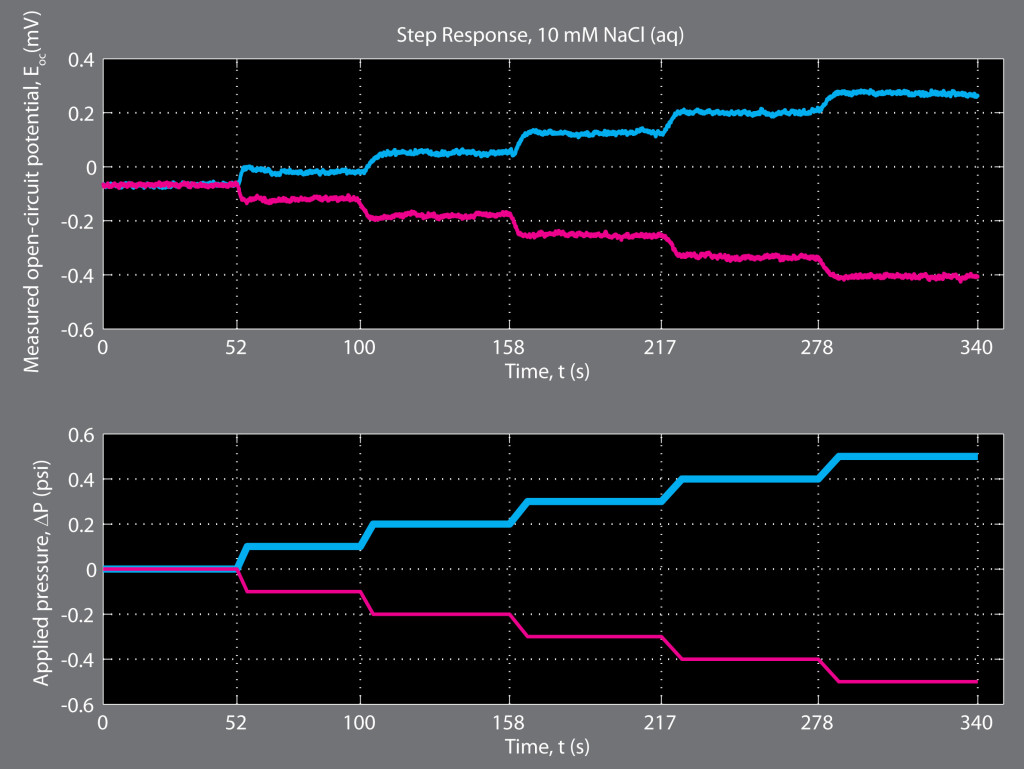
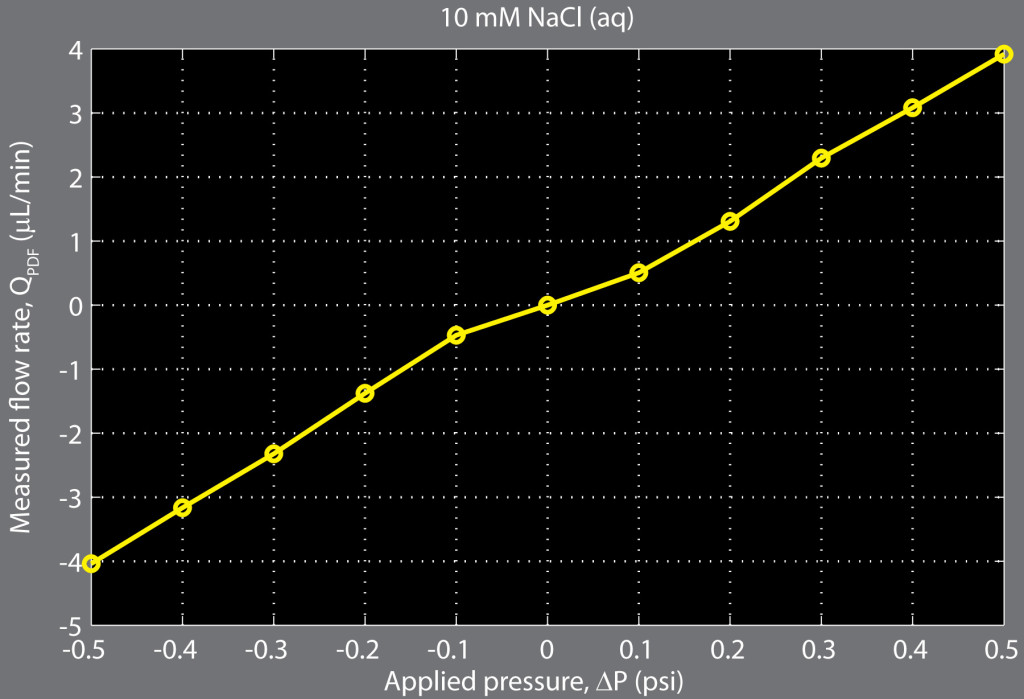
Figure 3 provides a characteristic curve for associating the open-circuit potential with the flow rate.
The transduction from the flow of electrolyte to electrical potential by the pnc-Si membrane is revealed in Figure 4.
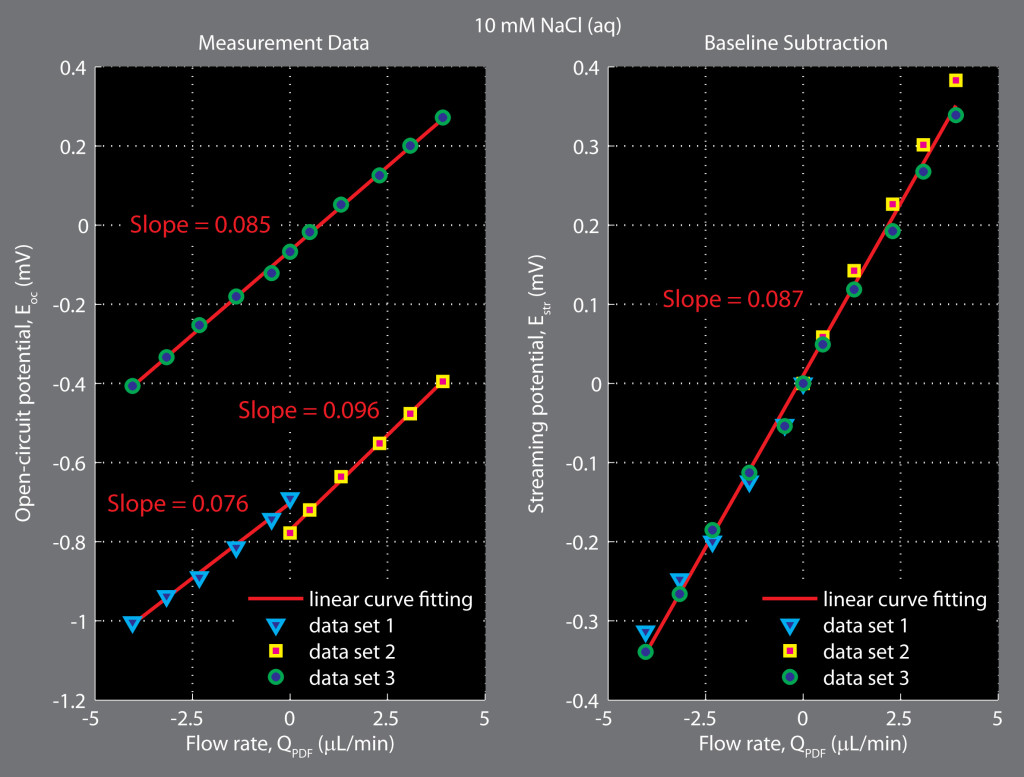
With this flow-sensing capability of the pnc-Si membrane, the flow rate can be dynamically obtained, or even regulated via feedback control, by simply monitoring the streaming potential.
Method: All measurement data were obtained using a single 30nm-thick pnc-Si membrane with 10 mM NaCl (aq) as electrolyte solution. The open-circuit potentials were measured by Gamry Reference 600 potentiostat in a two-electrode cell configuration. Both electrodes were made of Ag/AgCl and positioned about 1-2 mm from the membrane. The pressure-driven flows were controlled by a precision air pressure regulator.
Nice one! How do these measurements compare with the work Karl has been doing with his setup? I know you are using slightly different conditions and different machinery.
The noise levels look great! Eyeballing these noise levels, I’d say you could discriminate down to +/- 0.03 PSI after integrating over 2 seconds. In your setup, that’s ~0.30 uL/min, which is very impressive. There is some non-linearity in your Figure 3 graph near the origin, could it be a simple lack of data in this area, or are you approaching your sensitivity limits with such small flows? I imagine this area would be susceptible to any compliance in your system.
I believe the non-linearity in Figure 3 graph near the origin is due to the flow measurement method that I used. Since I determined the flow by tracking both menisci, the measurement at low applied pressure was susceptible to the menisci effect – an extra pressure drop incurs across each meniscus. At higher applied pressures, that extra pressure drop becomes comparatively negligible so that it does not affect the linearity of the graph further from the origin. Anyway, I have a solution for this problem and will address it in the future blog.