Analysis of Burst Pressure of HD Membranes
Introduction
PncSi membranes are used in the development of wearable hemodialysis (HD) device that provides with high toxin clearance rate for end-stage renal disease patients. Chips with 11 channels and a flow rate at 45 uL/min per channel were used in rat HD tests; these membranes, however, broke were not strong enough to sustain long period testing, and breaking membranes can lead to life-threatening consequences. We hypothesize that viscous fluids such as blood will accelerate deterioration and change the working transmembrane pressure. In this experiment, we are interested in collecting data for threshold of transmembrane pressure (burst pressure) at which membrane breaks during HD tests.
Experimental Setups
The model I used in my experiment is shown on the left. The ‘blood’ was added green food coloring to distinguish from the dialysate. An electrical pump was used to deliver blood to the membrane for clearance and also return to beaker, which stores blood. Dialysate was delivered to the other side of the membrane from the gravity fed IV bag, which was hung on the rack above.
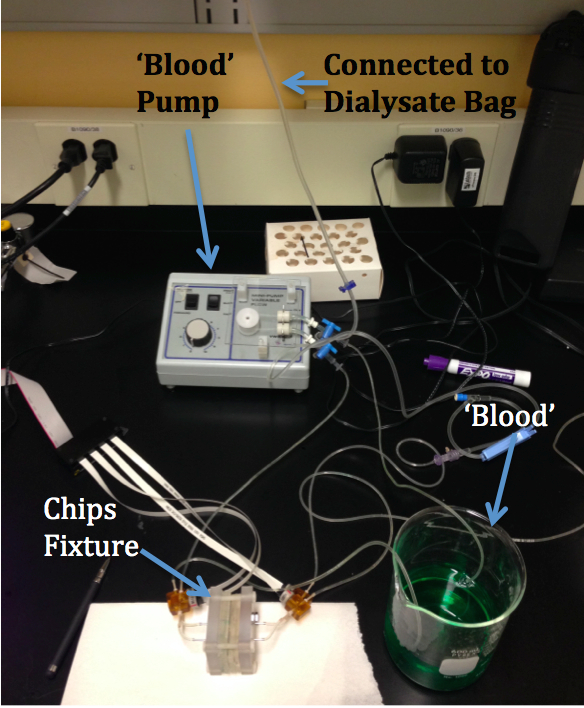
The chips are clamped in between two plastic plates for fixation (Figure 1). There are two PDMS gels on each side of the chips. The PDMS gel that has direct contact with the plates has drilled holes that allow fluid to flow through the inlet and outlet channels, and the PDMS gel that contacts the chip has grooves that distribute fluid into two chips with equal pathway length. The top part of this model circulates ‘blood’, which will be different fluids in our experiment in which water is used as a control. This ‘blood’ circulates to the chip and returs to a beaker, while the bottom part delivers dialysate. The fluid channels on the chip directly contact the top PDMS and the membrane side contacts the bottom PDMS with the gasket in between.
The inlets and outlets on the model were connected to four pressure transducers. The circulating of ‘blood’ was achieved using an electrical pump powered at low speed.
Method
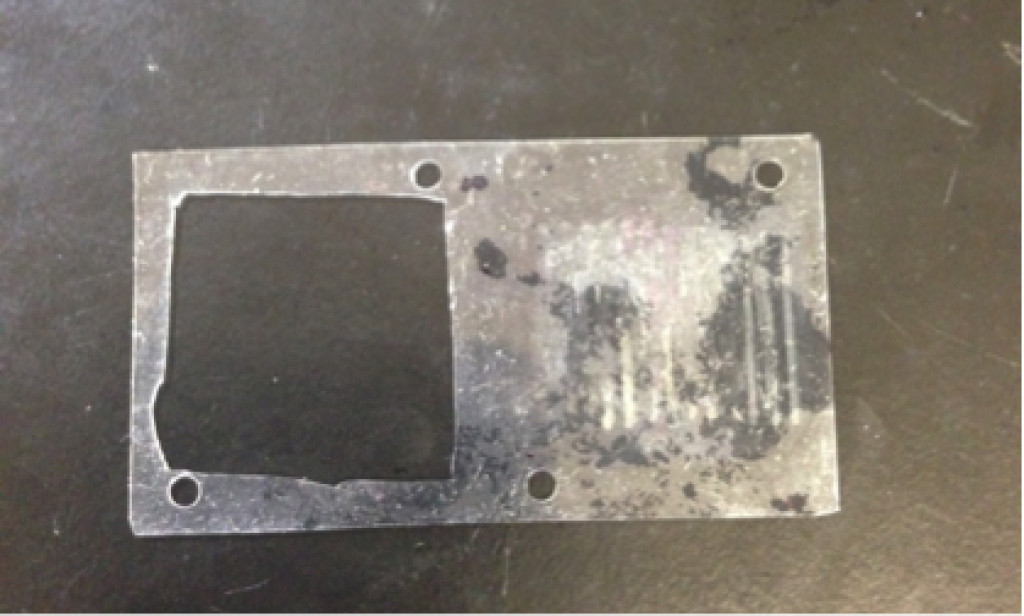
- In the first part of the experiment, a chip without membrane was used to determine the pressure difference between blood inlet and dialysate inlet. Instead of pncSi membrane, a gasket was used to separate the blood and the dialysate (as shown below). The chip has 11 channels, each with 500um x 10mm dimensions. A dummy chip was used to balance the thickness difference.
 The experiment contained two variables: the static fluid pressure (SFP) by adjusting the height of the gravity fed IV bag, and the flow rate (Q) by adjusting the speed gain on the pump. Four groups of experiment were performed, including high SFP and large Q, high SFP and small Q, low SFP and large Q, as well as low SFP and small Q. Each group was conducted at a triplet (n=3).
- In the second part of the experiment, we tested the transmembrane pressure by repeating the procedures described in the first part. This time the gasket covered the dummy chip instead so that the opening cut aligned with the subject chip. Water was used as both the ‘blood’ and dialysate. Burst pressure required to break the membrane was found by pinching off the return line on the ‘blood’ side. The ‘blood’ was colored using green food coloring to detect a break on the membrane. When the membrane breaks, we can see green color on the dialysate side. The burst pressures were found both before and after running water HD for 4 hours.
- In this part the fluid used was replaced with PBS to investigate the effects of viscosity on burst pressure. Other setups remained the same as in the previous part.
Results
- This figure shows the transmembrane pressures of each experimental group.

From statistical analysis, the difference high and low static fluid pressure is statistically significant. The difference between large and small flow rate, however, is not significant.
Since the difference in flow rate does not have much effects on transmembrane pressure, we run the second and third part of experiment at small flow rate only. The burst pressures for different fluid used are displayed in the table below.
| Fluid | Burst Pressure | ||
| n=1 | n=2 | n=3 | |
| water | ~ 11kPa (1.6 psi) | ||
| water (after 4 hours) | ~ 4kPa ( 0.58 psi) | ~ 10kPa | ~11kPa |
| PBS (after 4 hours) | ~ 10kPa | ~ 10kPa | |
Discussion
It seems that after running the fluid for 4 hours, the membrane was much weakened, and it broke at a much lower pressure difference. The burst pressure results, however, is not consistent with our hypothesis that more viscous fluid yields lower burst pressures because of more rapid deterioration. Observations on the membranes were made before and after the 4-hour experiments, and we found that the breaks were rather small in water than in PBS. When PBS was used and after the membrane broke, the entire channel broke; in experiments using water, however, the membrane had very tiny breaks, making the detection of green coloring on the dialysate side much more difficult. This caused more uncertainty in determining the burst pressures in water compared to PBS, since I was able to see green coloring diffused into the dialysate flow immediately after the membrane broke. It is reasonable to assume that different viscosity of fluid will lead to discrepancy in breaking mechanism. Besides, both the membrane and the food coloring are charged, which can possibly make it even hard for food coloring to diffuse through a small break in water, whereas its charges in salt water (PBS) has less impacts. We also noticed that the working transmembrane pressure was very close to the burst pressure even for fresh membranes.
Note that the sample size for each group is very small due to limited number of chips we own.
The burst pressure the first 4-hour experiment with water is very different from the other two groups, presumably because the chip in the first group was broken on the next day of running the 4-hours experiment, so it had been soaked in water overnight, which weakened it even more.
For future works, more experiment for each group should be performed in order to do statistical analysis. Other more viscous fluid, for example FBS and blood, can be used to compare the burst pressure with that of water and PBS. Also a more accurate method needs to be used to determine burst pressure. We found the transmembrane pressure will immediately drop from around 3kPa to below 1kPa after breaking, so we can gradually increase the return line pressure to its maximum with an equal increment, and then analyze the data in MATLAB to find the time point where we see an immediate transmembrane pressure drop.