Vindictive Virus Capture: Testing the μSiM-DX with Vaccinia Virus Towards a Modular Virus Diagnostic
After completing proof of concept testing with polystyrene beads and with the goal of creating a SARS-CoV-2 sensor (Discussed in this post: https://trace-bmps.org/beadazzled-laying-the-foundation-of-the-%ce%bcsim-dx-fouling-based-sensor/), we sought to test the performance of the system with a target more similar to the SARS-CoV-2 virus. We found this target in vaccinia virus. As we did with the polystyrene beads, we tested the μSiM-DX with the virus and appropriate controls. In addition, we determined the dynamic range of the μSiM-DX by testing over a range of vaccinia virus concentrations. After testing we were able to image virus capture on the membranes and determine that we were capturing single virus and virus aggregates. Lastly, we were able to test lysed intact vaccinia virus with the μSiM-DX and show that it did not provide positive test results. Overall these experiments provided us with the results to prove that the μSiM-DX added complimentary value to the field of point of care SARS-CoV-2 diagnostics.
Testing the μSiM-DX with Intact Vaccinia Virus
Like SARS-CoV-2, the Vaccinia virus is an enveloped virus. Unlike SARS-CoV-2, vaccinia virus is safe to handle and is about 300 nm in size (which is larger than SARS-CoV-2). For these reasons, we chose to use it as a surrogate for SARS-CoV-2. After testing the μSiM-DX with polystyrene beads at a concentration of 10^5 beads/mL, we began vaccinia virus at the same concentration (10^5 virus/mL). Similar to the bead test, I injected 40 μL of solution using a pipette. This produced a positive test result with the μSiM-DX. The positive test result is shown in the video below.
2 slot 10^5 vaccinia+antibody Capture
To determine a dynamic range for the μSiM-DX, I tested using the same conditions over a range of concentrations. I did this with both 2 window and 3 window μSiM-DX devices to see the effect of membrane capacity on the performance of the sensor. To determine the limit of detection, I tested vaccinia virus mixed with streptavidin conjugated vaccinia antibody at progressively lower concentrations until a switch was not triggered by the solution. To determine the upper limit of detection, I injected vaccinia virus without streptavidin conjugated vaccinia antibody with progressively higher concentrations until a switch was triggered by the solution. A positive switch with this solution is nonspecific due to the lack of antibody, and therefore a false positive. In this instance the membrane is occluded via nonspecific physical capture of the virus as opposed to the specific affinity-based capture that is facilitated by the streptavidin conjugated antibody and the biotin coated membrane surface. The results of these experiments are shown in Figure 1 and Table 1.
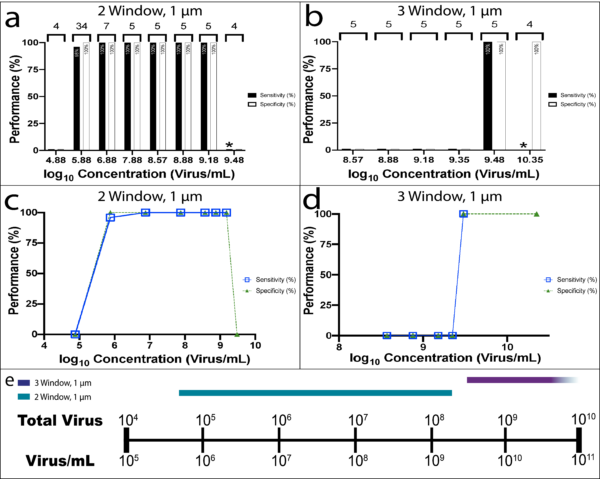
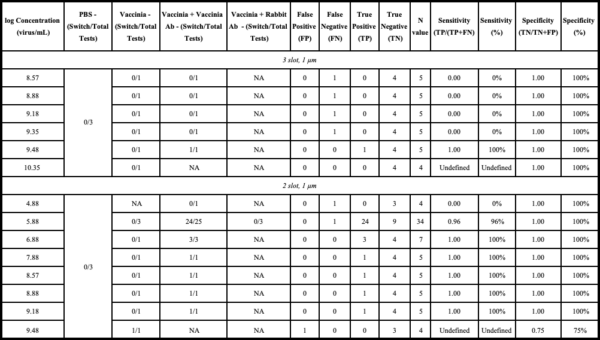
After gathering these results, we realized that membrane capacity effected the dynamic range of the μSiM-DX significantly. The lower capacity two window μSiM-DX had a dynamic range which went as low as 10^5.9 virus/mL and as high as 10^9.2 virus/mL. The dynamic range of the higher capacity three window μSiM-DX was not nearly as low, but was fortuitously complimentary to the two window μSiM-DX, picking off where the two window μSiM-DX performance begins to fail. The dynamic range of the two window μSiM-DX almost covers the entire range of mean viral loads of patients infected with SARS-CoV-2 (10^5.6-10^7 RNA copies/mL – T. C. Jones et al., “Estimating infectiousness throughout SARS-CoV-2 infection course,” Science (American Association for the Advancement of Science), p. eabi5273, 2021, doi: 10.1126/science.abi5273).
Using a different version of the μSiM-DX (3 window 0.5 μm slit pore membrane with a tube in the indicator port), I tested two virus controls. One had no streptavidin conjugated antibody, and the other had a streptavidin conjugated isotype control antibody. Both produced negative test results in the μSiM-DX, but had more of a switch than PBS. To try to reduce these partial switches, I prefiltered these solutions and tested them in the μSiM-DX. Prefiltering eliminated the partial switches of the controls, but also reduced the switch that we got from vaccinia virus with the proper streptavidin conjugated antibody. These results are interesting but not unexpected, and may have far reaching implications moving forward. Nonetheless, we were encouraged by these results and moved on to image virus capture to get an idea of how the membrane was occluded by the virus and to see if we were capturing single virus particles.
Imaging Vaccinia Virus Captured in the μSiM-DX
To visualize vaccinia virus capture on our membranes within the μSiM-DX, I imaged the devices after injection of vaccinia virus mixed with streptavidin conjugated antibody on URNano’s confocal microscope. Baturay took these images and used the specs of the microscope and camera to determine how many pixels a 300 nm vaccinia virus should take up in an image (~3 pixels). With this information he was able to sweep through the image and highlight all particles that had this size. These are shown in Figure 2 highlighted with blue boxes.
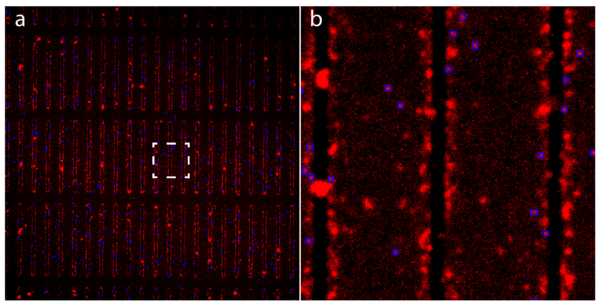
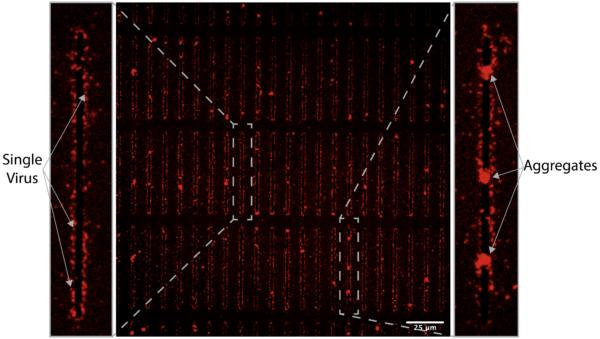
This analysis reveals that not only are we capturing single vaccinia virus, but we are also capturing vaccinia virus aggregates. These are highlighted in Figure 3.
Testing the μSiM-DX’s Ability to Differentiate Between Intact and Sub-viral Vaccinia Virus
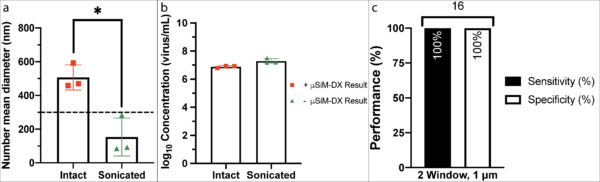
Now knowing the dynamic range of the μSiM-DX, we next wanted to determine if it could differentiate between intact vaccinia virus and lysed, sub-viral vaccinia particles. To create sub-viral particles, I probe sonicated solutions of vaccinia virus using our probe sonicator at its highest setting for 1 minute. DLS confirmed the creation of subviral particles, which is shown in Figure 4. I completed qPCR (assay published here: J. L. Baker and B. M. Ward, “Development and comparison of a quantitative TaqMan-MGB real-time PCR assay to three other methods of quantifying vaccinia virions,” Journal of virological methods, vol. 196, pp. 126-132, 2014, doi: 10.1016/j.jviromet.2013.10.026.) on both solutions (intact vaccinia virus and sonicated vaccinia virus), and found that as we expected, they provided similar results showcasing qPCR’s inability to differentiate between intact and sub-viral virus (Figure 4). On the other hand, the μSiM-DX provided a negative test result every time a sonicated virus sample mixed with streptavidin conjugated vaccinia antibody was injected into the device (shown in the video below), and a positive test result every time an intact virus sample mixed with streptavidin conjugated vaccinia antibody was injected into the device.
The diagnostic sensitivity and specificity calculated using these test results are shown in Figure 4 and Table 2, proving the ability of the μSiM-DX to differentiate between intact and sub-viral vaccinia virus.

Conclusions and Future Work
Overall these experiments revealed the true value of the μSiM-DX as a diagnostic sensor. When optimized, the μSiM-DX can perform accurately and reliably and its dynamic range can be tuned for specific target concentration ranges. The μSiM-DX performs well with vaccinia virus and was shown to capture single virus particles. In addition it was shown that the μSiM-DX can differentiate between intact and sub-viral vaccinia virus. Moving forward there are many routes this work could take, some of which include testing the performance of the μSiM-DX using biofluids, testing with SARS-CoV-2 virus particles, and modeling the system in order to gain a better understanding of its working principles. Some work has been done towards the last effort, and this will be discussed in my next blog post.
Appendix
Vaccinia virus control videos
*All tests are done with 3 window 0.5 μm slit pore membranes and a tube in the indicator port and 10^8 virus/mL solutions
PBS
Vaccinia virus with streptavidin conjugated antibody
Vaccinia virus with no antibody
Vaccinia virus with streptavidin conjugated isotype control antibody
Pre-filter vaccinia virus capture videos
*All tests are done with 3 window 0.5 μm slit pore membranes and a tube in the indicator port and 10^8 virus/mL solutions
PBS
Vaccinia virus with streptavidin conjugated antibody
Vaccinia virus with no antibody
Vaccinia virus with streptavidin conjugated isotype control antibody