Assessing Neutrophil Activation inside a Flow Cell Device with Flow Cytometry
Introduction
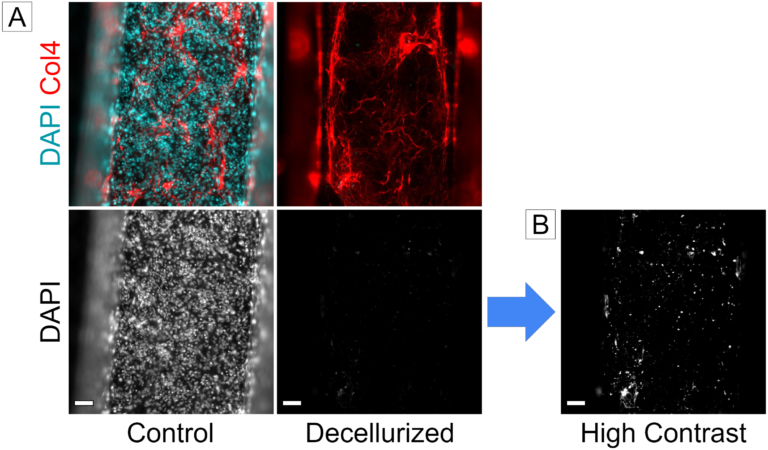
As part of our continuing evaluation of the flow cell developed by our collaborators at RIT, our next goal is to demonstrate that neutrophils remain inactivated when flown through a first generation device (Figure 1). For this, we studied neutrophil activation as a function of fluid flow induced shear stress based on the physical device geometry with antibody staining and flow cytometry. Physiologically, neutrophils express L-selectin when in an inactive state which is then cleaved off the cell surface upon activation. By staining for this marker, as well as Mac-1 (which becomes up-regulated on a neutrophil surface upon activation), we are able to qualitatively assess neutrophil activation.

Methods
Neutrophil isolation was performed via established protocol. We’ve published this previously as part of our monocyte isolation procedure. The steps/reagents for neutrophil isolation are the same, the only difference is that a different white blood cell layer is isolated from a 1-step polymorphs density separation gradient (Alere Technologies, Norway) and no additional selection is required.
The negative control neutrophils were obtained by suspending 900k cells/mL from isolation stock into isolation buffer (HBSS– – w/ 10 mM HEPES Sodium Salt, 5 mg/mL BSA) inside a 1.5 mL conical, which was then placed on a circular rotation rotisserie to prevent neutrophil settling.
The positive control neutrophils were placed in MCDB-131 Complete Media (VEC Technologies) supplemented with 10 ng/mL IL8 (rh CXCL8/IL-8, R&D Systems) at a concentration of 900k cells/mL in a 1.5 mL conical. IL8 is capable of chemically activating neutrophils and settling/sticking was prevented by placing the conical on a rotisserie. The neutrophils were incubated with IL8 for 15 minutes before being rinsed and stained.
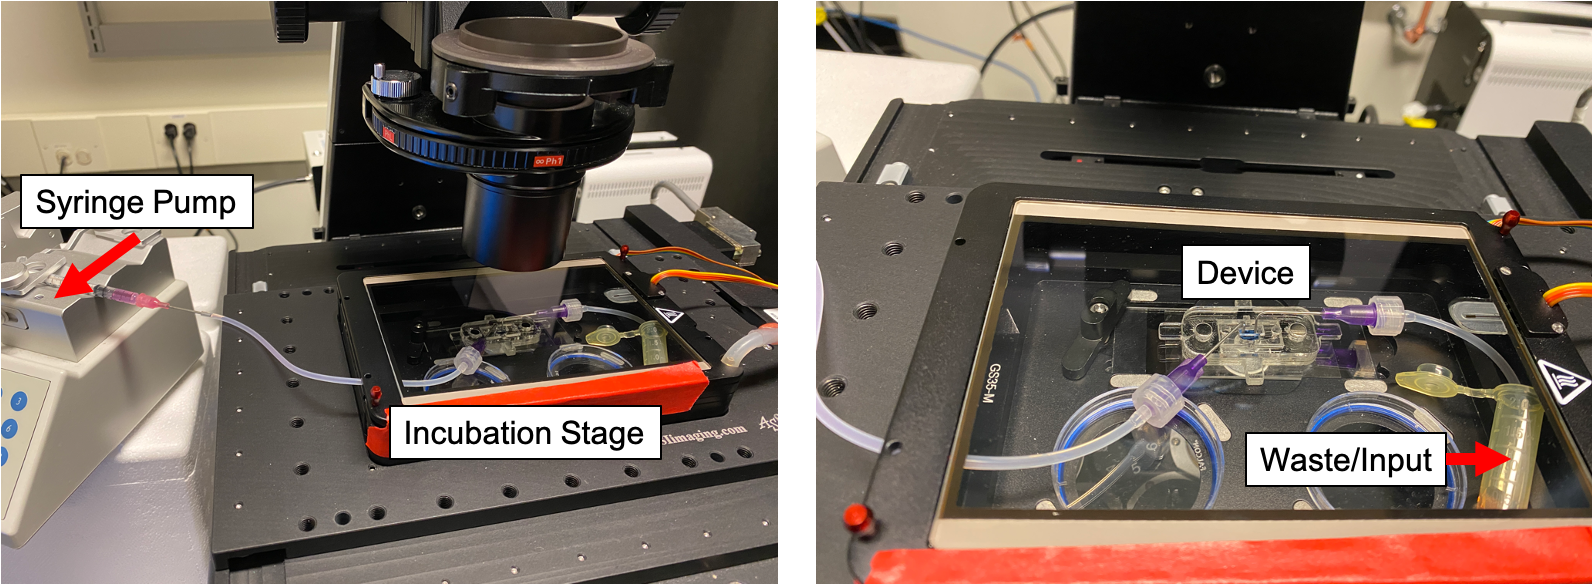
Device assembly for the µSiM was performed as per usual instructions, where each device incorporates a nanoporous membrane chip (Lot 1398, φ = ~18%, pd = ~55 nm). No cells (e.g. HUVECs, hCMEC/D3) were seeded onto the membrane surfaces of these devices, as the goal was to assess if the flow insert itself was capable of activating neutrophils based on geometry and physical forces imparted from flow conditions. These completed µSiM devices were then incorporated into first generation flow cells (Figure 1). In order to isolate syringe geometry from our analysis, we cut enough 1/32″ inner diameter silicon tubing (Model 95802-01, Cole Parmer) to hold at least 400 µL of neutrophil rich media. Flow parameters for the device were adapted from finite element analysis modeling performed by Mehran (RIT), where a flow rate of 10 µL/min solicits a maximum shear stress of ~1 dyne/cm2 in the top flow channel. The flow modality adapted for this study was a pulling flow, where fluid from a non-agitated reservoir filled with suspended neutrophils (3M cells/mL) in media (MCDB-131 Complete, VEC Technologies) was drawn into the device towards a syringe pump over a length of 40 minutes. This was done on both a bench top setting (no incubation) and an incubation stage (37oC, 5% CO2, +Humidity, Figure 2). 3M cells/mL was chosen for the reservoir concentration as the reservoir contained 1 mL of fluid, so flowing 400 µL would result in ~1.2M PMNs flown into the device, then accounting for loss from the reservoir side tubing/device we should expect ~900k PMNs to be flown into the syringe pump side tubing.
After all conditions were run, the samples were collected in 1.5 mL conicals, spun down in a centrifuge (5 mins @ 200g), supernatant aspirated, and pellets re-suspended in 400 µL buffer (Flow Cytometry 1x Staining Buffer, R&D Systems). The 400 µL suspension for each experiment was then distributed into four 100 µL aliquots (also in 1.5 mL conicals) representing the unstained control, isotype control, L-selectin stain, and Mac 1 stain (all antibodies are conjugated with AF488, from R&D systems). Staining was performed according to protocol (5 µL antibody solution/ 1 mil cells as a lower bound, +30 mins in dark fridge, additional rinse/centrifugation for stained groups, final volumes at 200 µL) and flow cytometry performed on a Guava EasyCyte benchtop flow cytometry machine. Sampling was set at either 1000 or 3000 gated events (higher events were possible with more recovery, more on that later in the results/discussion) and data gathered analyzed in FCS Express, Graphpad PRISM, and Wolfram Mathematica. The methods for the histogram distance measurement will be discussed in another post.
Results/Discussion
Our initial results suggested that PMN recovery from the first generation flow cell device was poor, making any conclusions drawn about PMN behavior in the flow cell device difficult to make (Figure 3). Despite this, there is a clear trend of non-activation in what little was collected in the flow cell when compared to PMN behavior in the positive control (+10 ng/mL IL8).
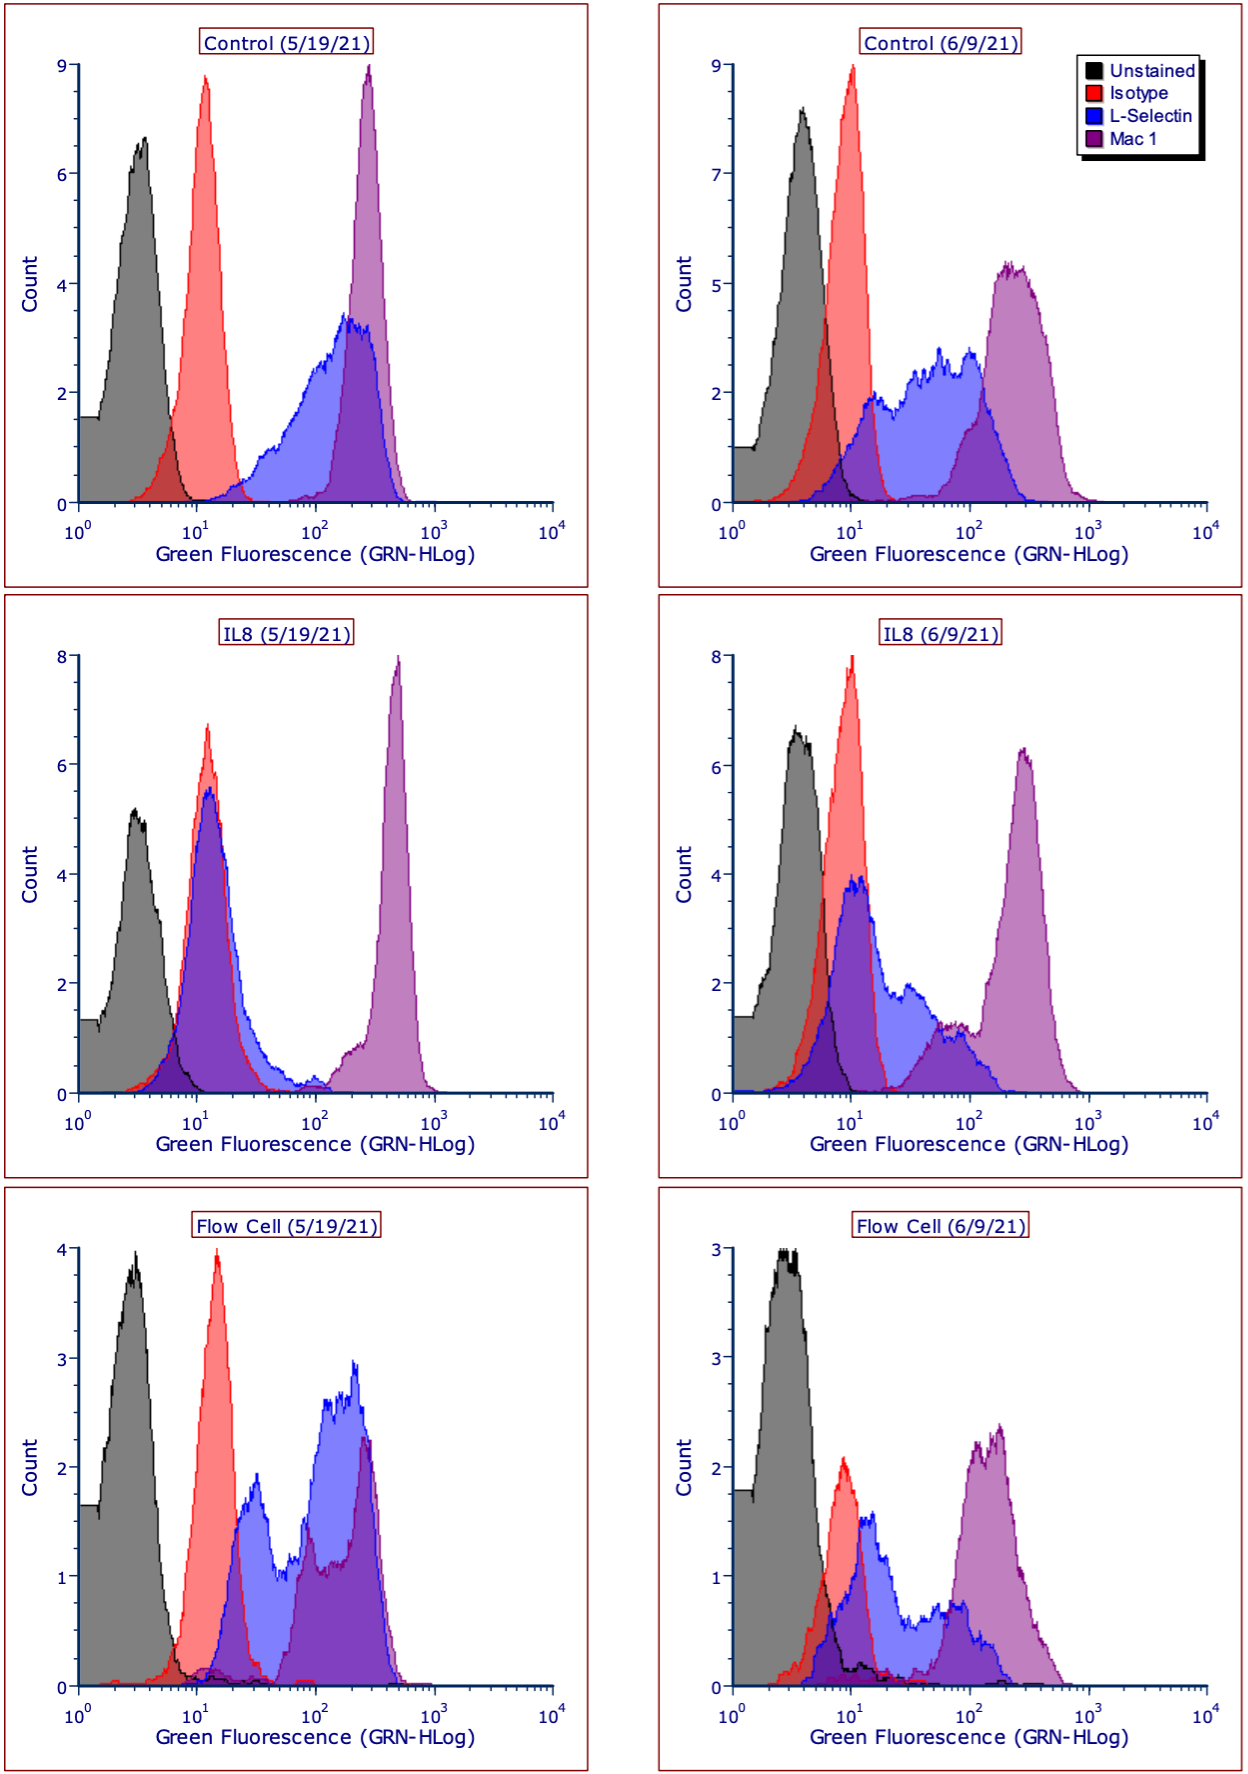
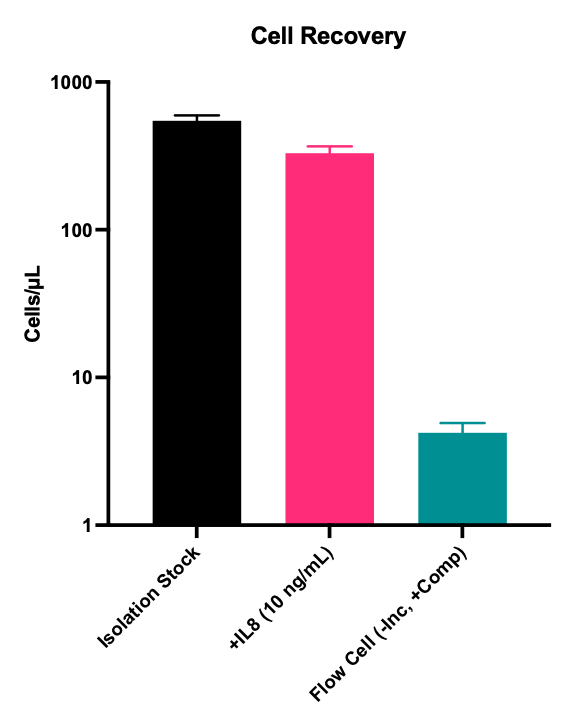
Note, although the Flow Cell histograms display ~33% counts (y-axis) versus the controls, these histograms took significantly longer to develop (>3 mins vs seconds for the controls). Thus, comparing y-axis scaling/histogram peaks between conditions is inappropriate. Instead, the flow cytometer provides a count of “cells/µL” obtained during a run (Figure 4).
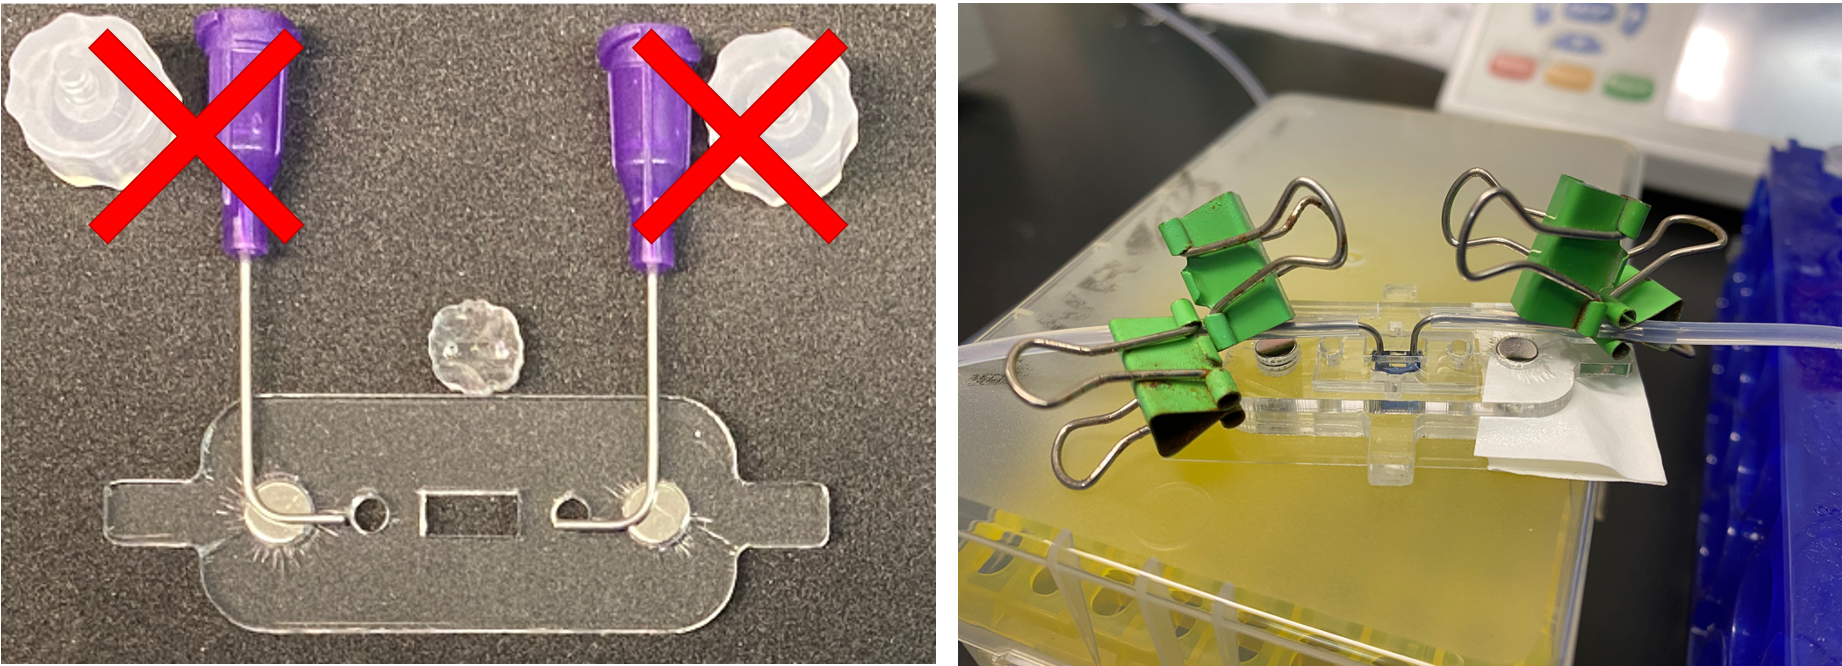
We hypothesized that much of the loss occurring in the system was due to syringe hubs and the associated tubing junctions. By removing them (Figure 5), we increased our recovery rate dramatically (Figure 6).
Recovery increases to roughly ~100 cells/µL, and occurs over a shorter time period as well.

With better handling, recovery rate can increase to roughly 21-25% compared to the negative control (Figure 7). Note, that all subsequent figures will drop the “Comp” label as all following experiments were done without them. The other 75% representing PMN loss is likely due to settling in the main reservoir, noting that the reservoir is non-agitated and neutrophils have are known to rapidly settle on the side walls and bottom of a conical. With these sets of experiments, attempts were also made to assess recovery from an incubated flow cell.

The counts were much lower (~5 cells/µL) versus a benchtop flow cell (~200 cells/µL) and the L-selectin/Mac1 peak distributions indicated that all recovered PMNs were activated (Figure 8).

This behavior is expected, and does not change our current conclusion that PMNs are not activated via physical forces experienced inside of the flow cell. To quantify this observation in a meaningful manner, we calculated the distance between the L-selectin histogram and isotype control histogram via Jaccard index, J(A,B), as a metric for activation (Figure 9).

Conclusion
From this series of experiments, we conclude that the physical geometry of the flow cell device will maintain an un-activated PMN physiology. The inclusion of incubation activates neutrophils, however this is expected. The recovery rates for neutrophils from the first generation flow cell device, when excess components are removed, increases dramatically and is within acceptable boundaries. The next post will go over histogram analysis via histogram difference measurements.