Competitive ELISA assay to measure the HA shedding from HUVEC monolayer
Competitive ELISA assay to measure the HA shedding from HUVEC monolayer
Introduction
The endothelial glycocalyx is a dense layer of proteoglycans, glycoproteins, and glycosaminoglycans (GAGs) that helps maintain the integrity of the endothelial cell (EC) barrier.1 The main GAGs are heparan sulfate (HS), chondroitin sulfate, and hyaluronic acid (HA), among which HS and HA are the most abundant.2 Glycocalyx degradation happens in the early stage of systematic inflammation/sepsis in vivo,3-6, and plasma levels of HA and HS increase compared to healthy controls.7 Thus, the increase of HA or HS in the plasma can be an indicator of glycocalyx degradation due to inflammation/sepsis in vivo. In this assay, we focused on the HA shedding from a monolayer of human umbilical vein endothelial cells (HUVECs). In order to simulate HA shedding from HUVECs, I used hyaluronidase (HA-ase), an enzyme that cleaves HA from the endothelial glycocalyx layer. Cleaved HA in culture media was quantified by competitive ELISA assay.
Methods
Cell Culture
HUVEC culture in the µSiM followed the protocol posted by Molly. Cells were cultured on both 96-well plates and Aline devices (NPN membrane, trench-down). HA-ase treatments were conducted once HUVECs formed a confluent monolayer (Figure 1).
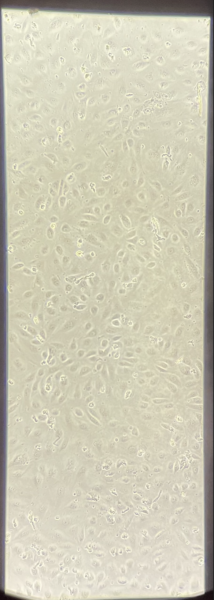
Figure 1 HUVECs on 1-slot Aline device reached 100% confluency 22 h after seeding.
Hyaluronidase Treatment
HA-ase was diluted from 100 U/ml to 10 U/ml with HUVEC media. Once cells reached 100% confluency, HUVECs were treated with the HA-ase for 2 hours in the incubator. We found that the FBS used for MCDB131 complete media contains high levels of HA. This has the potential to create a high background reading in the ELISA assay. To find an optimum that minimized the impact of background HA, but also maintained healthy HUVECs, we tested HA-ase treatment in: serum-free, 1% FBS media, 3% FBS media, and 10% FBS media (MCDB131 complete media). Serum-free media, 1% FBS media, 3% FBS media, and 10% FBS without HA-ase were also incubated with cells for 2 h as control groups. Cell supernatants were obtained after 2 h’s incubation with cells. 1% FBS media, 3% FBS media were MCDB 131 complete media diluted in serum-free media.
ELISA Assay
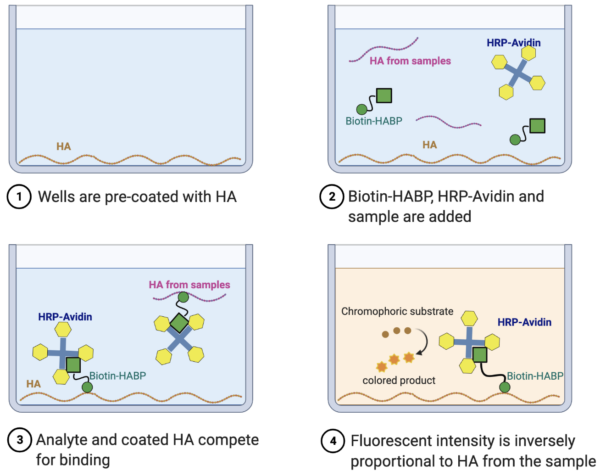
Created in BioRender.com
Competitive ELISA was conducted according to the Hyaluronan Quantification Kit protocol. A standard curve was generated for each ELISA assay (Figure 2b and Figure 3b) and HA concentrations of the samples and controls were calculated according to this standard curve.
Results
96 well data (Figure 2; Table 1)
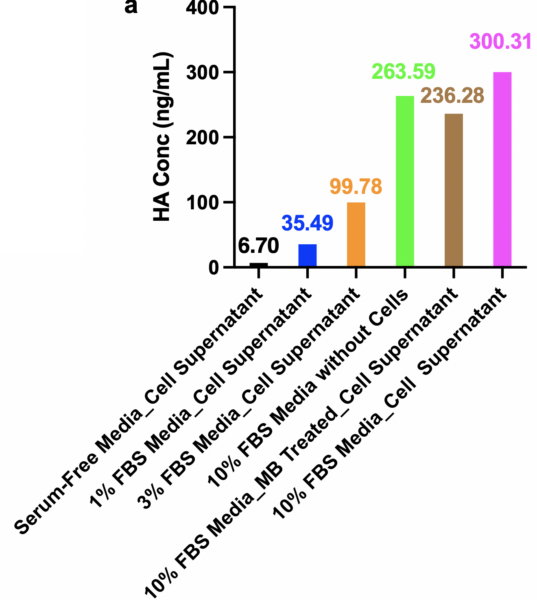
Data were first obtained from HUVECs cultured on 96-well plates. We first treated ECs with 10 U/mL HA-ase in complete media for 2 hours at 37° and collected the supernatant from plates in duplicate. We measured a resulting level of HA of 1.3 µg/mL. Concerned that a significant amount of this could be coming from HA present in the 10% FBS used for complete media, we repeated the assay without the addition of HA-ase and found that complete media contained around 300 ng/ml of HA or about 23% of the total seen with cells and HA-ase.
**************************************
2) A low percent of FBS media did not trigger HA shedding from the HUVEC. Specifically, we found (Figure 2) that: HA concentrations from 1% FBS cell supernatant, 3% FBS cell supernatant, and 10% FBS cell supernatant were 35.49 ng/ml, 99.79 ng/ml, 300.31 ng/ml, respectively. Since the ratio of HA concentrations of 1% FBS cell supernatant to 3% FBS cell supernatant, to 10% FBS cell supernatant was 1: 3 : 10, perfectly matched the serum-containing ratios, 1 : 3 : 10, we concluded that the low serum levels are not causing HA shedding on ECs as an artifactual response to the reduction in serum. We conclude that all the signal measured from ECs that have not been treated with HA-ase is from the FBS in the media. Since no/low FBS of media triggered no HA shedding from HUVECs and showed negligible/low background to the HA measurement, serum-free media, and 1% FBS media are good choices for HA-ase dilution for HA-ase treatment. Rather than use serum-free media which may harm the ECs, we selected 1% FBS as the carrier for HA-ase addition to cells in future experiments.
As an alternative method to remove HA from complete media, we also tried magnetic streptavidin beads (MB) that we pre-loaded with the biotinylated HABP. While according to the manufacturer’s protocol, there should have been enough binding capacity to remove all the HA from the media, we only found there was still more than 200 ng/mL of HA in the media following our depletion attempt (Last bar of Figure 2a). Given the success of the FBS dilution approach, we did not attempt to optimize this method further.
b
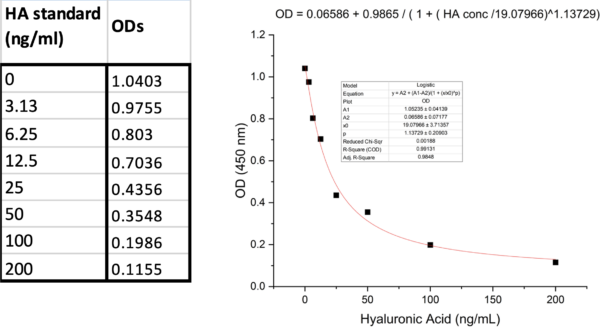
Figure 2 a. HA concentrations of media-only samples and cell supernatants in 96-well plate and b. corresponding standard curve of this assay.
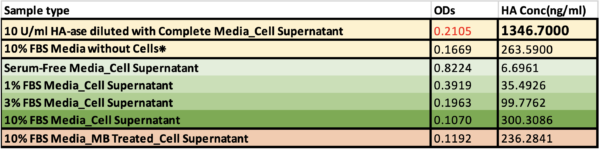
Table 1 Fluorescent intensities (ODs) and corresponding HA concentrations of cell supernatants from 96-well plate.
❊ 10% FBS Media without Cells was measured another day using a different standard curve. Cell supernatants from HA-ase treatment groups were diluted with serum-free media (1:15) to obtain detectable ODs.
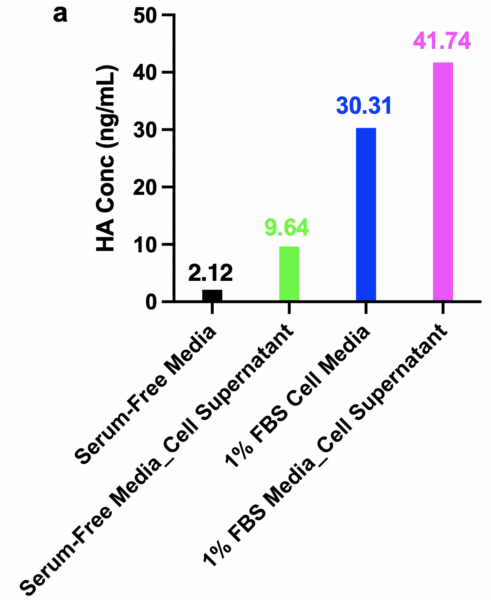
HUVECs were then cultured on Alines to further verify the preliminary data from 96-well plates and prepare the assay for the introduction of flow. HA background signal from the serum-free and 1% FBS cell supernatants on Alines were consistent with on 96-well plates. HA from serum-free and 1% FBS cell supernatants on Alines were 9.64 ng/ml and 41.74 ng/ ml (vs. 6.69 ng/ml and 35.49 ng/ml on 96-well plate). The HA concentrations from both serum-free media diluted HA-ase treatment and 1% FBS media diluted HA-ase treatment groups were much higher than from the 96-well plate, 17642.08 ng/ml and 16084.94 ng/ml vs. 1628.62 ng/ml and 1346.70 ng/ml, respectively. The reasons for the significantly higher concentration of HA from cells observed on the Aline devices are still unknown. It may be that polystyrene, which the 96-well plate is made of, can absorb peptides from the serum up to 50%.8 Besides, the HA concentrations on Alines, 17642.08 and 16084.94 ng/ml, were still within reasonable range9-11.
b
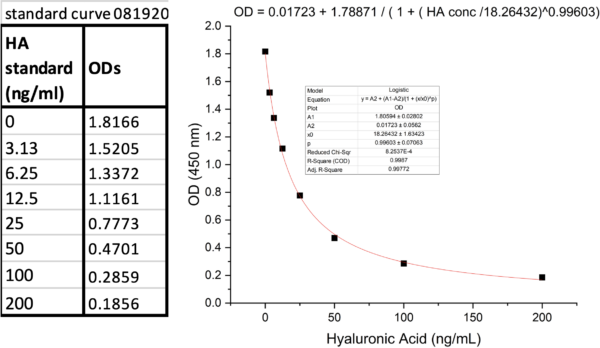
Figure 3 a. HA concentrations of media-only groups and cell supernatants from Aline devices, b. corresponding standard curve of this assay.

Table 2 ODs and corresponding HA concentrations of media-only groups or cell supernatants from Alines.
❊Cell supernatants from HA-ase treatment groups were diluted with serum-free media (1:96 or 1:100) to obtain detectable ODs.
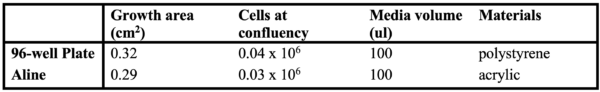
Table 3 Comparison between 96-well plate and Aline device.
Conclusion
1% FBS media can be used for HA-ase dilution. The amount of HA shedded after the HA-ase treatment on Alines was high enough to introduce flow into the devices afterward. By quantifying the shedding of HA, this ELISA assay quantitatively indicated the degradation of the glycocalyx layer of the HUVECs. The next step is to introduce shear stress into the devices and further analyze the glycocalyx changes under in vivo level shear.
References
- Weinbaum, S.; Tarbell, J. M.; Damiano, E. R., The structure and function of the endothelial glycocalyx layer. Annu Rev Biomed Eng 2007, 9, 121-67.
- Tarbell, J. M.; Cancel, L. M., The glycocalyx and its significance in human medicine. J Intern Med 2016, 280 (1), 97-113.
- Fels, J.; Jeggle, P.; Liashkovich, I.; Peters, W.; Oberleithner, H., Nanomechanics of vascular endothelium. Cell and Tissue Research 2014, 355 (3), 727-737.
- Curry, F. E.; Adamson, R. H., Endothelial glycocalyx: permeability barrier and mechanosensor. Ann Biomed Eng 2012, 40 (4), 828-39.
- Fu, B. M.; Tarbell, J. M., Mechano-sensing and transduction by endothelial surface glycocalyx: composition, structure, and function. Wiley Interdiscip Rev Syst Biol Med 2013, 5 (3), 381-90.
- Tarbell, J. M.; Pahakis, M. Y., Mechanotransduction and the glycocalyx. J Intern Med 2006, 259 (4), 339-50.
- Schmidt, E. P.; Yang, Y.; Janssen, W. J.; Gandjeva, A.; Perez, M. J.; Barthel, L.; Zemans, R. L.; Bowman, J. C.; Koyanagi, D. E.; Yunt, Z. X.; Smith, L. P.; Cheng, S. S.; Overdier, K. H.; Thompson, K. R.; Geraci, M. W.; Douglas, I. S.; Pearse, D. B.; Tuder, R. M., The pulmonary endothelial glycocalyx regulates neutrophil adhesion and lung injury during experimental sepsis. Nat Med 2012, 18 (8), 1217-23.
- Goebel-Stengel, M.; Stengel, A.; Taché, Y.; Reeve, J. R., Jr., The importance of using the optimal plasticware and glassware in studies involving peptides. Analytical biochemistry 2011, 414 (1), 38-46.
- Landsverk, S. A.; Tsai, A. G.; Cabrales, P.; Intaglietta, M., Impact of Enzymatic Degradation of the Endothelial Glycocalyx on Vascular Permeability in an Awake Hamster Model. Critical Care Research and Practice 2012, 2012, 842545.
- Buhren, B. A.; Schrumpf, H.; Gorges, K.; Reiners, O.; Bölke, E.; Fischer, J. W.; Homey, B.; Gerber, P. A., Dose- and time-dependent effects of hyaluronidase on structural cells and the extracellular matrix of the skin. European Journal of Medical Research 2020, 25 (1), 60.
- Huang, Z.; Zhao, C.; Chen, Y.; Cowell, J. A.; Wei, G.; Kultti, A.; Huang, L.; Thompson, C. B.; Rosengren, S.; Frost, G. I.; Shepard, H. M., Recombinant Human Hyaluronidase PH20 Does Not Stimulate an Acute Inflammatory Response and Inhibits Lipopolysaccharide-Induced Neutrophil Recruitment in the Air Pouch Model of Inflammation. The Journal of Immunology 2014, 192 (11), 5285.