Ibidi (Rev B) Device
Introduction
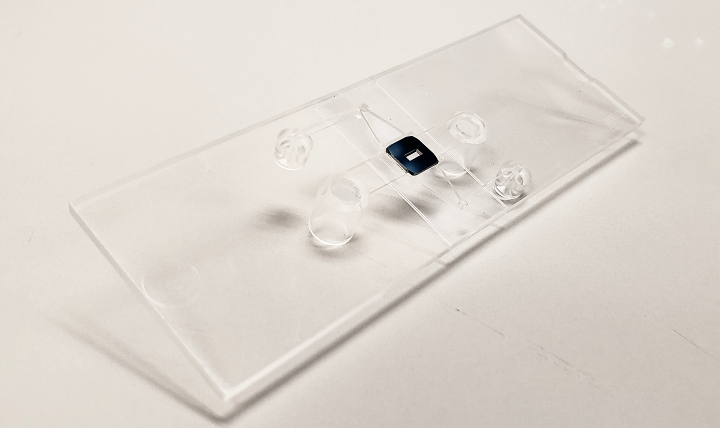
This post is meant to introduce the new NPN-enabled slide-based devices produced by Ibidi. These devices feature an NPN membrane and microfluidic channels positioned perpendicular to one another formed by PSA and COP layers (Figure 1). Channels above and below the membrane allow for flow-based experiments including tangential flow filtration (TFF) such that biofluids could potentially be processed to analyze extracellular vesicles (EVs). Since the device is slide-based, capture experiments can be imaged live and time-series imaging would allow for recording the entire capture process. Additionally, these devices require no manipulation between capture and imaging which results in representative analyses as there is little potential for loss.
Methods
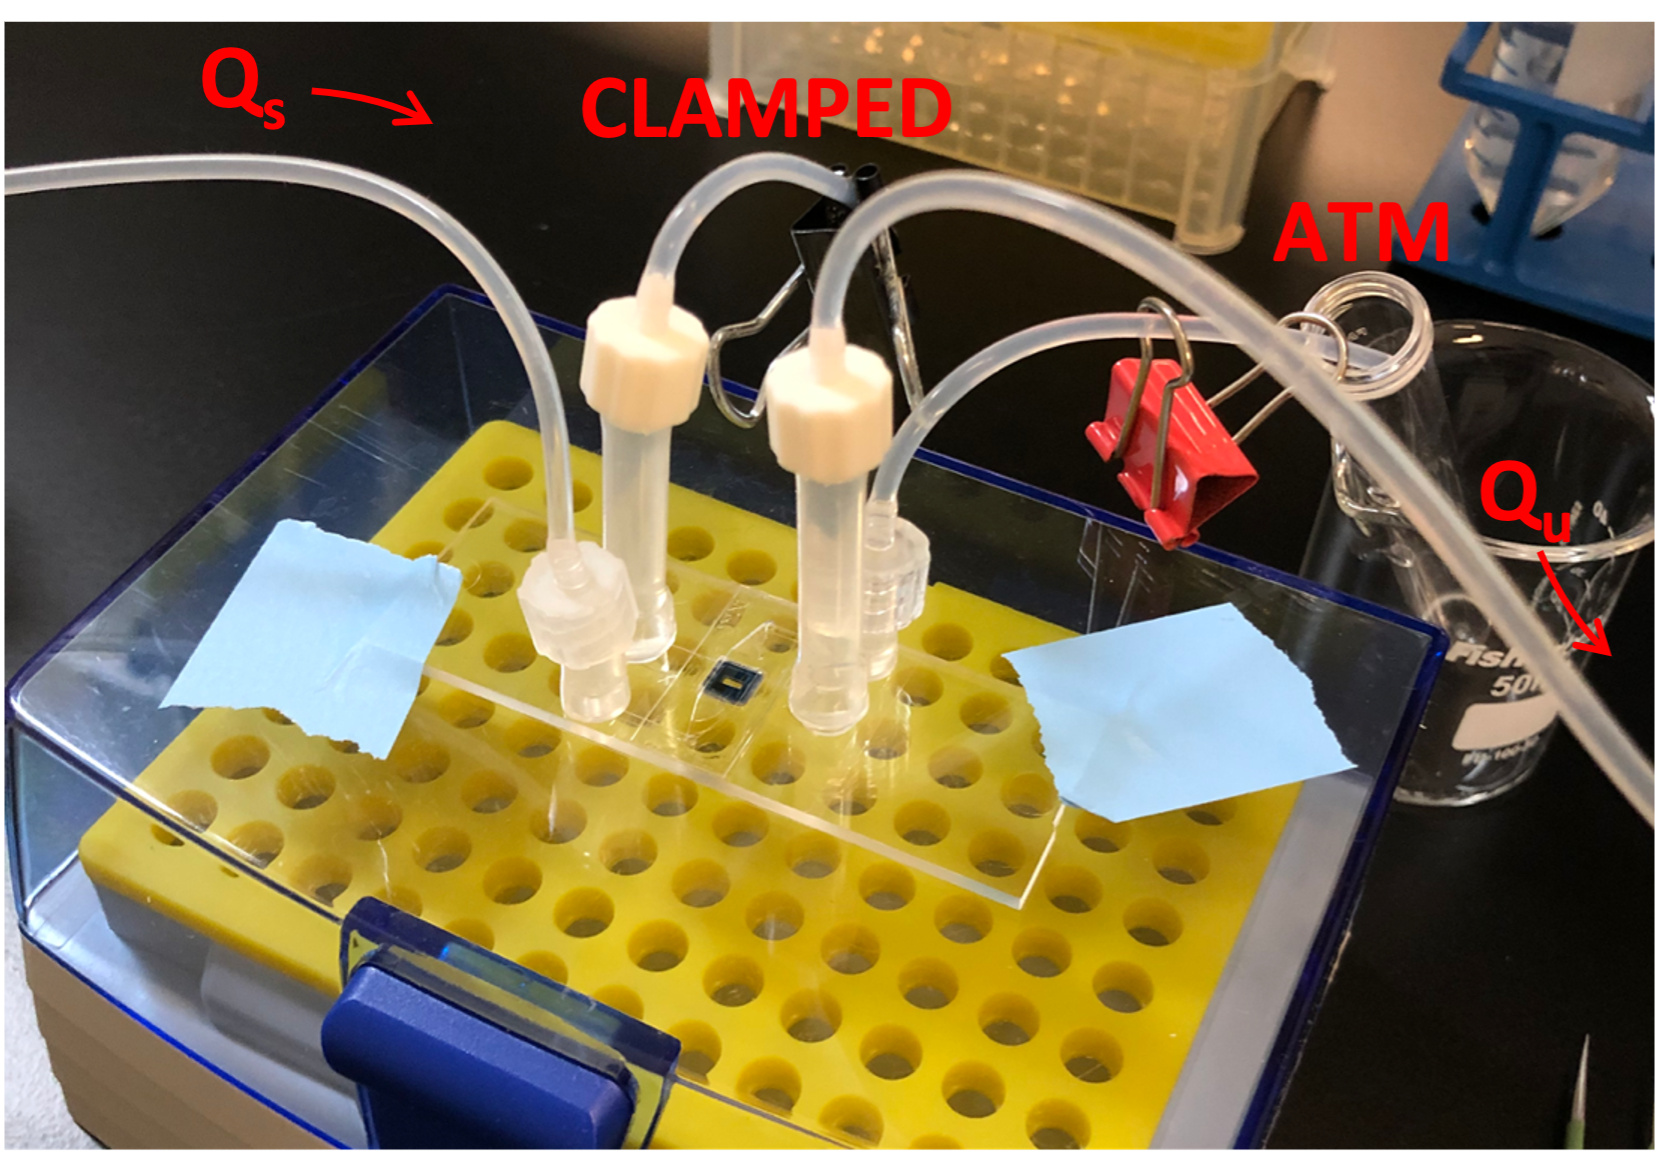
In this preliminary experiment, an Ibidi device was used to capture 100 nm fluorescent beads. Beads were diluted to a concentration of 105 beads/mL and 2 mL of solution was processed using a TFF flow regime. Prior to capture, microfluidic tubing and top/bottom channels were primed with PBS. The supply rate (Qs) in the top channel was maintained at 50 μL/min and the ultrafiltration rate (Qu) in the bottom channel was maintained at 25 μL/min. Consistent with earlier tangential flow for analyte capture (TFAC) experiments, a flux ratio (Qu/Qs) = 0.5 was established and the top outlet was left open to atmosphere and the bottom channel inlet was clamped (Figure 2). Following capture, tubing was removed and the device was imaged using the confocal microscope.
Following positive bead capture results, we wished to test if EVs could be captured and imaged using the Rev B device. A plasma sample was diluted to an approximate EV concentration of 107 EVs/mL and EVs were labeled with CFSE. The EV solution was prefiltered using a 0.5 μm membrane and further diluted to a concentration of 105 EVs/mL. Prior to capture, the bottom channel was primed with PBS and the top channel was primed with 1 mg/mL BSA to block the membrane. As before, 2 mL of solution was processed using a TFAC flow regime (Qs = 50 μL/min, Qu 25 μL/min).
Results & Discussion
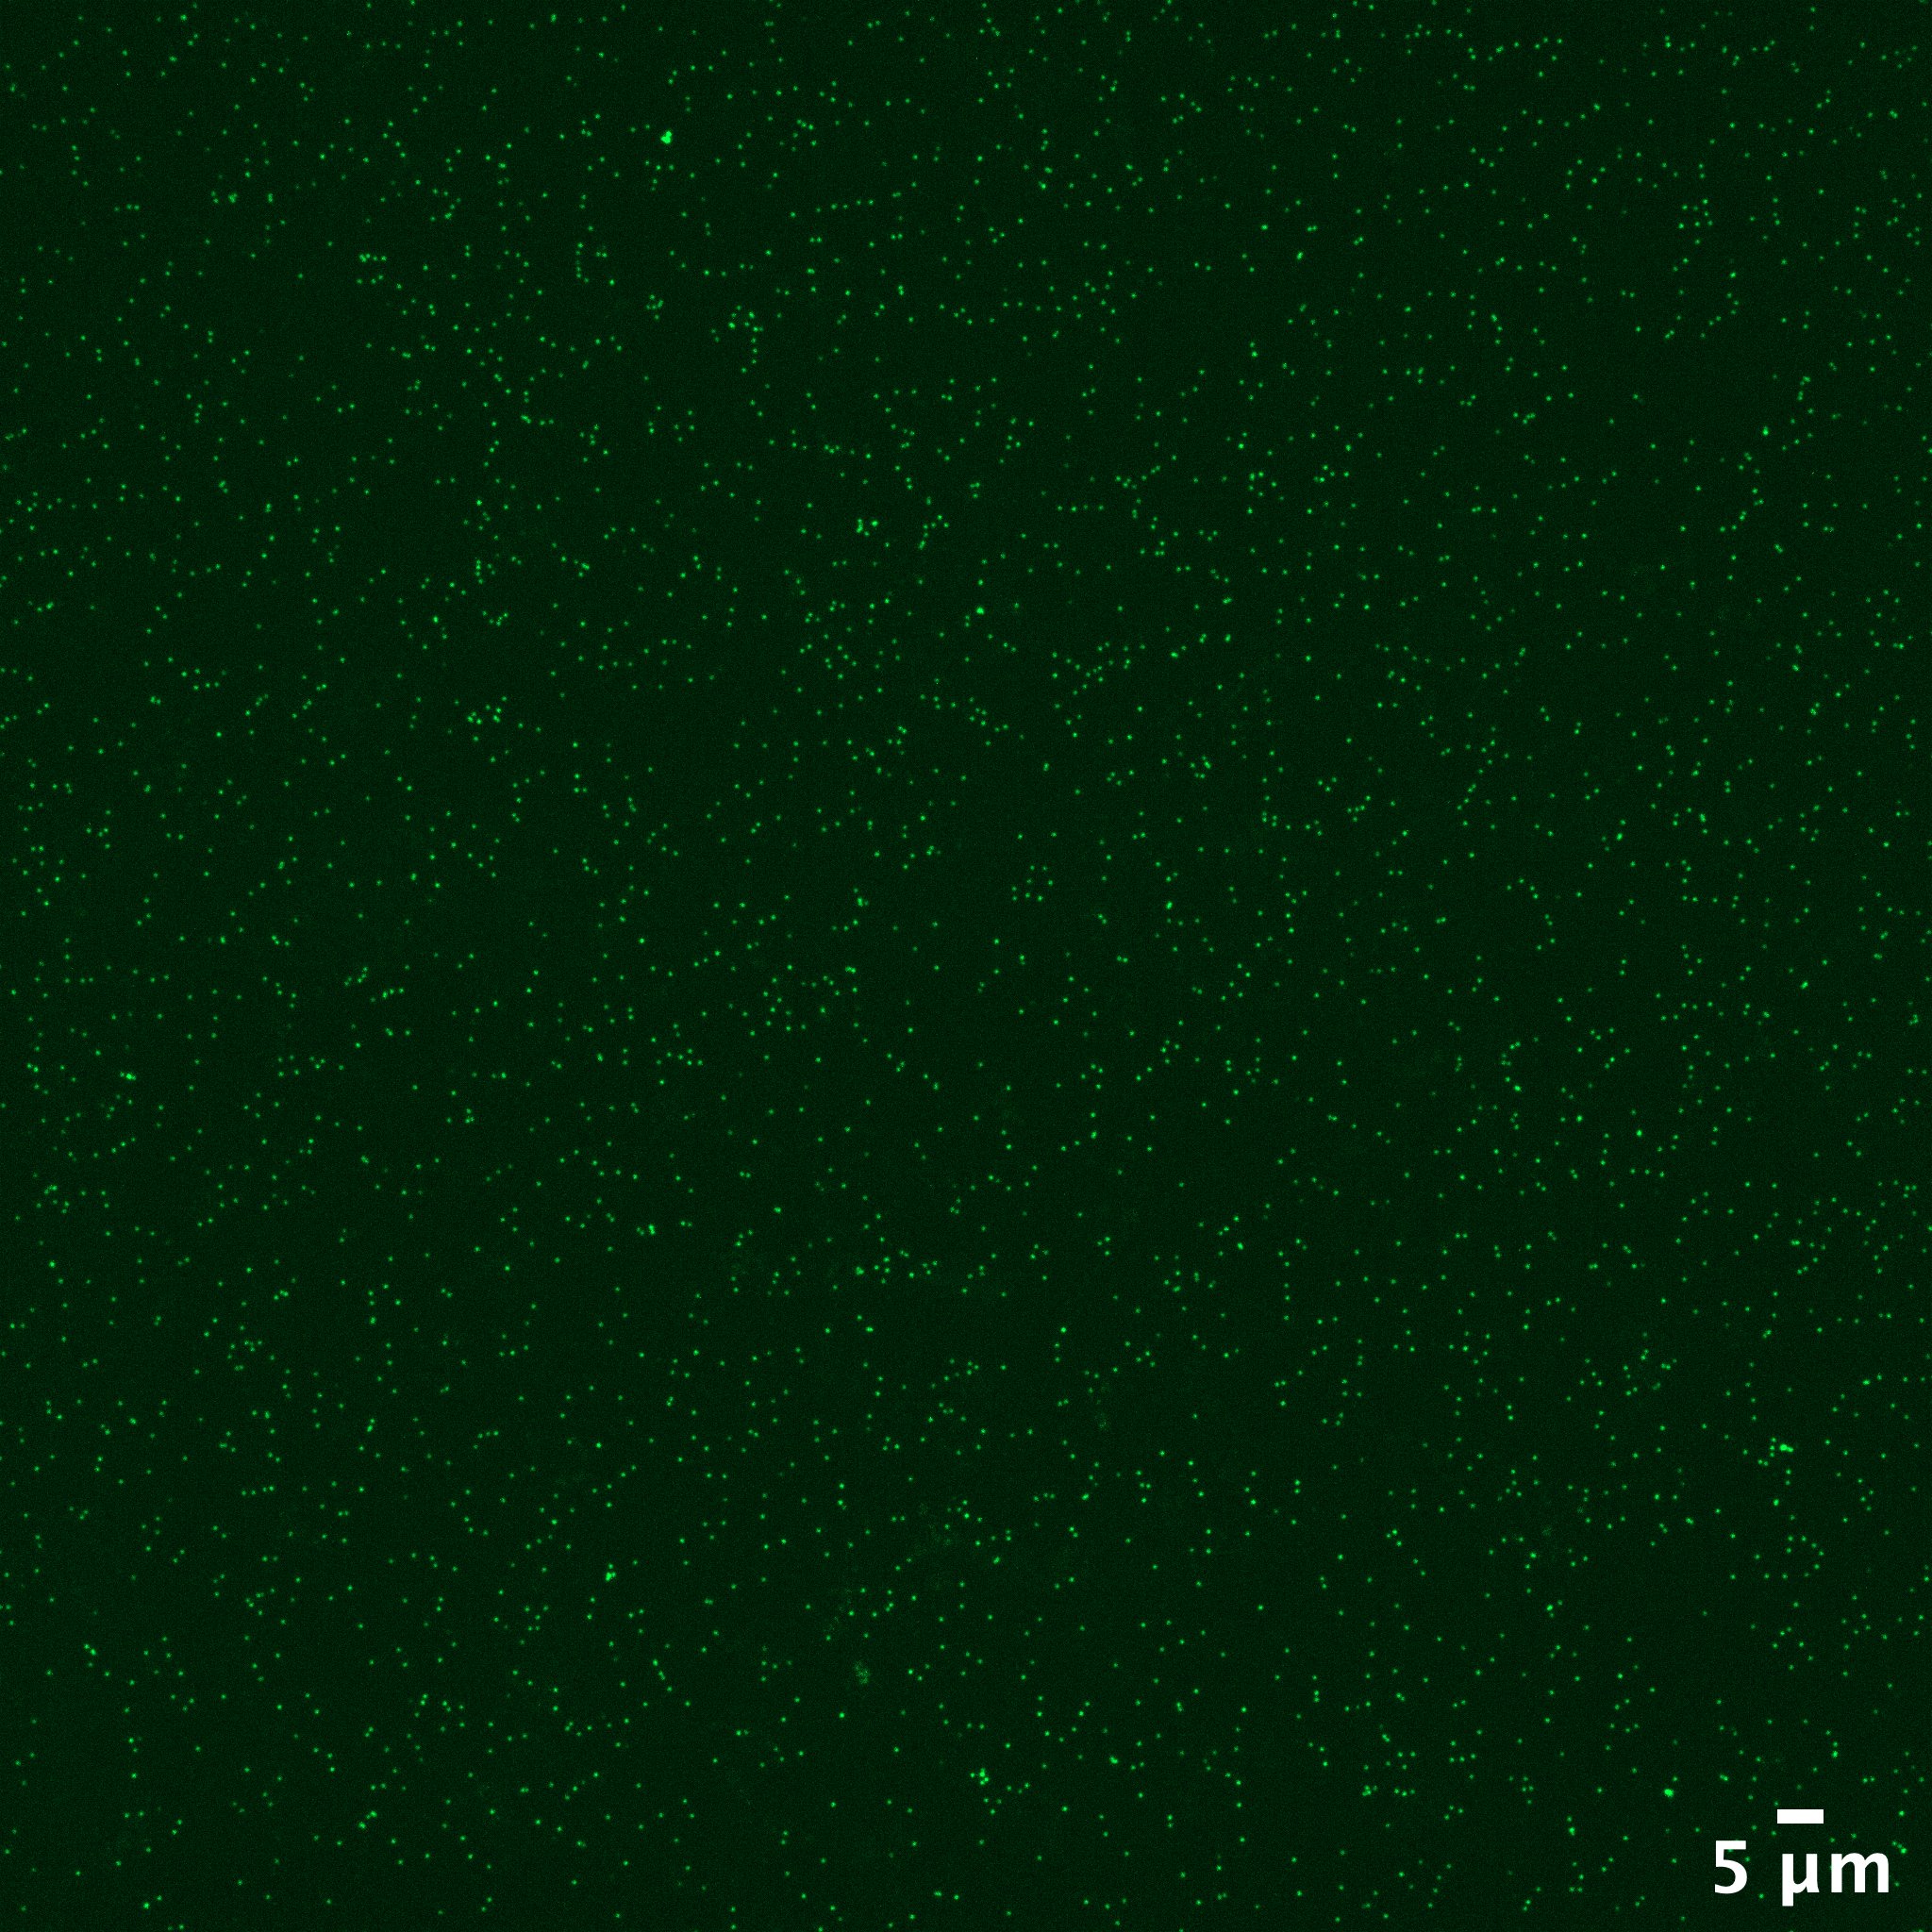
A representative image of bead capture is shown in Figure 3. Using multiple fields of view an average bead count (per field of view) can be generated and extrapolated to the total area of the membrane to approximate bead capture. It is estimated that 1.2 * 105 beads were captured compared to an approximate input of 1.8 * 105. This appears to be an efficient capture process and some of the discrepancy is likely due to dilution error when preparing the bead solution or the fact that the channels were primed with PBS. Before capture can occur, the PBS in the top channel needs to be cleared and this additional volume is not accounted for in the bead input calculation. It should be noted that there is a substantial amount of dead volume in the device including the ports and larger tubing, it takes ~500 μL to prime the top channel and nearly a full mL to prime the bottom channel. This may not be a concern when large input volumes are used but this complicates matters for small-volume inputs.
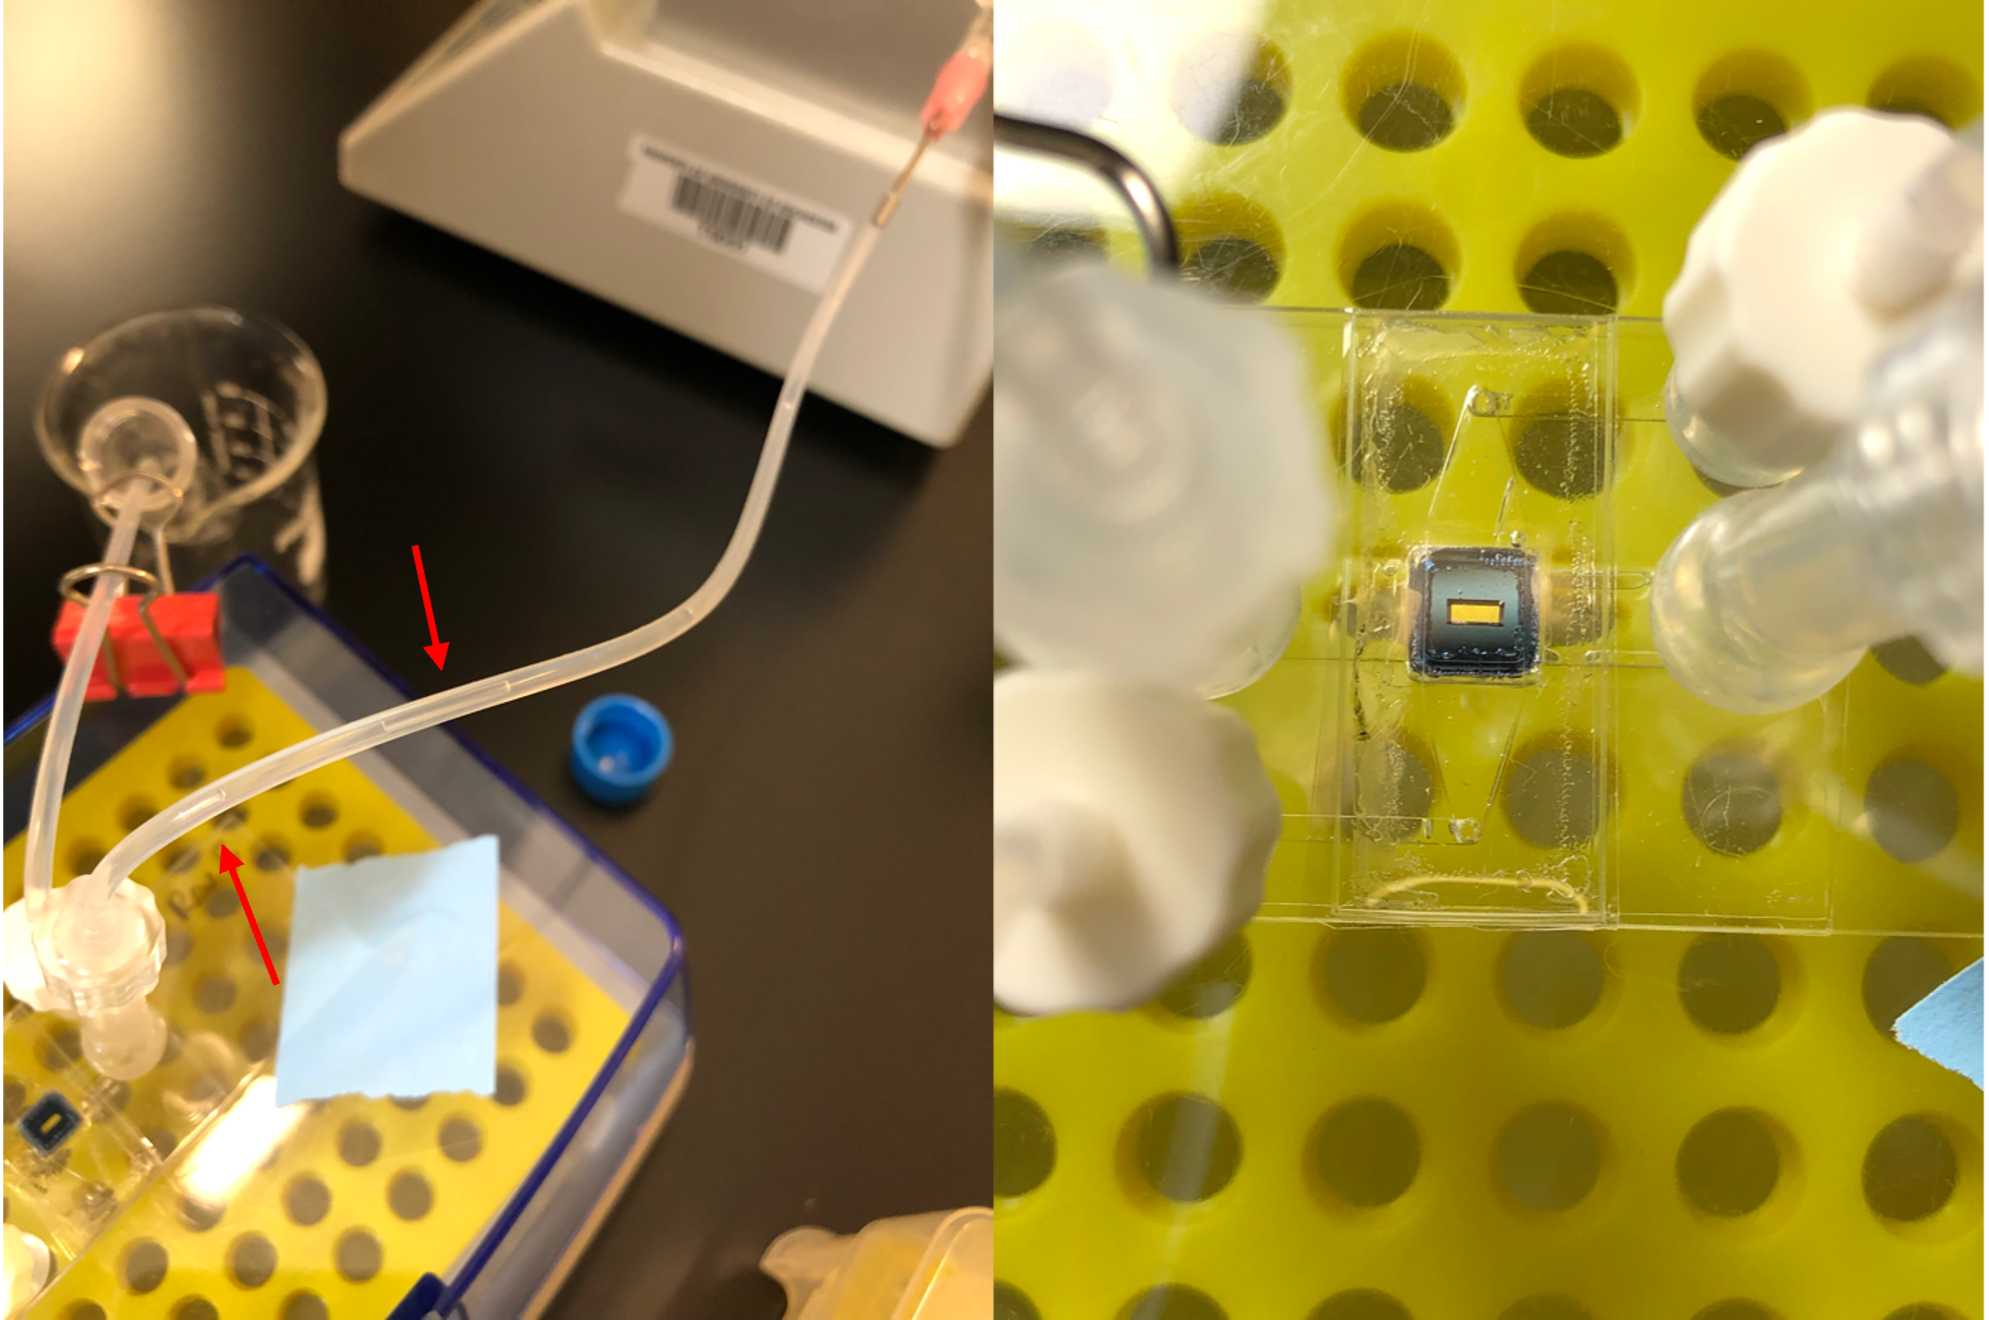
After beads were successfully captured, an attempt at EV capture was made. During this experiment, the device was compromised; air infiltrated the filtrate portion of microfluidic tubing and the membrane appeared to become depressurized (Figure 4). The device did not start leaking fluid; however, air must have been pulled in somewhere by the syringe pump driving ultrafiltration. Additionally, usually during TFAC experiments you can observe the membrane flexing indicating that there is constant transmembrane pressure.
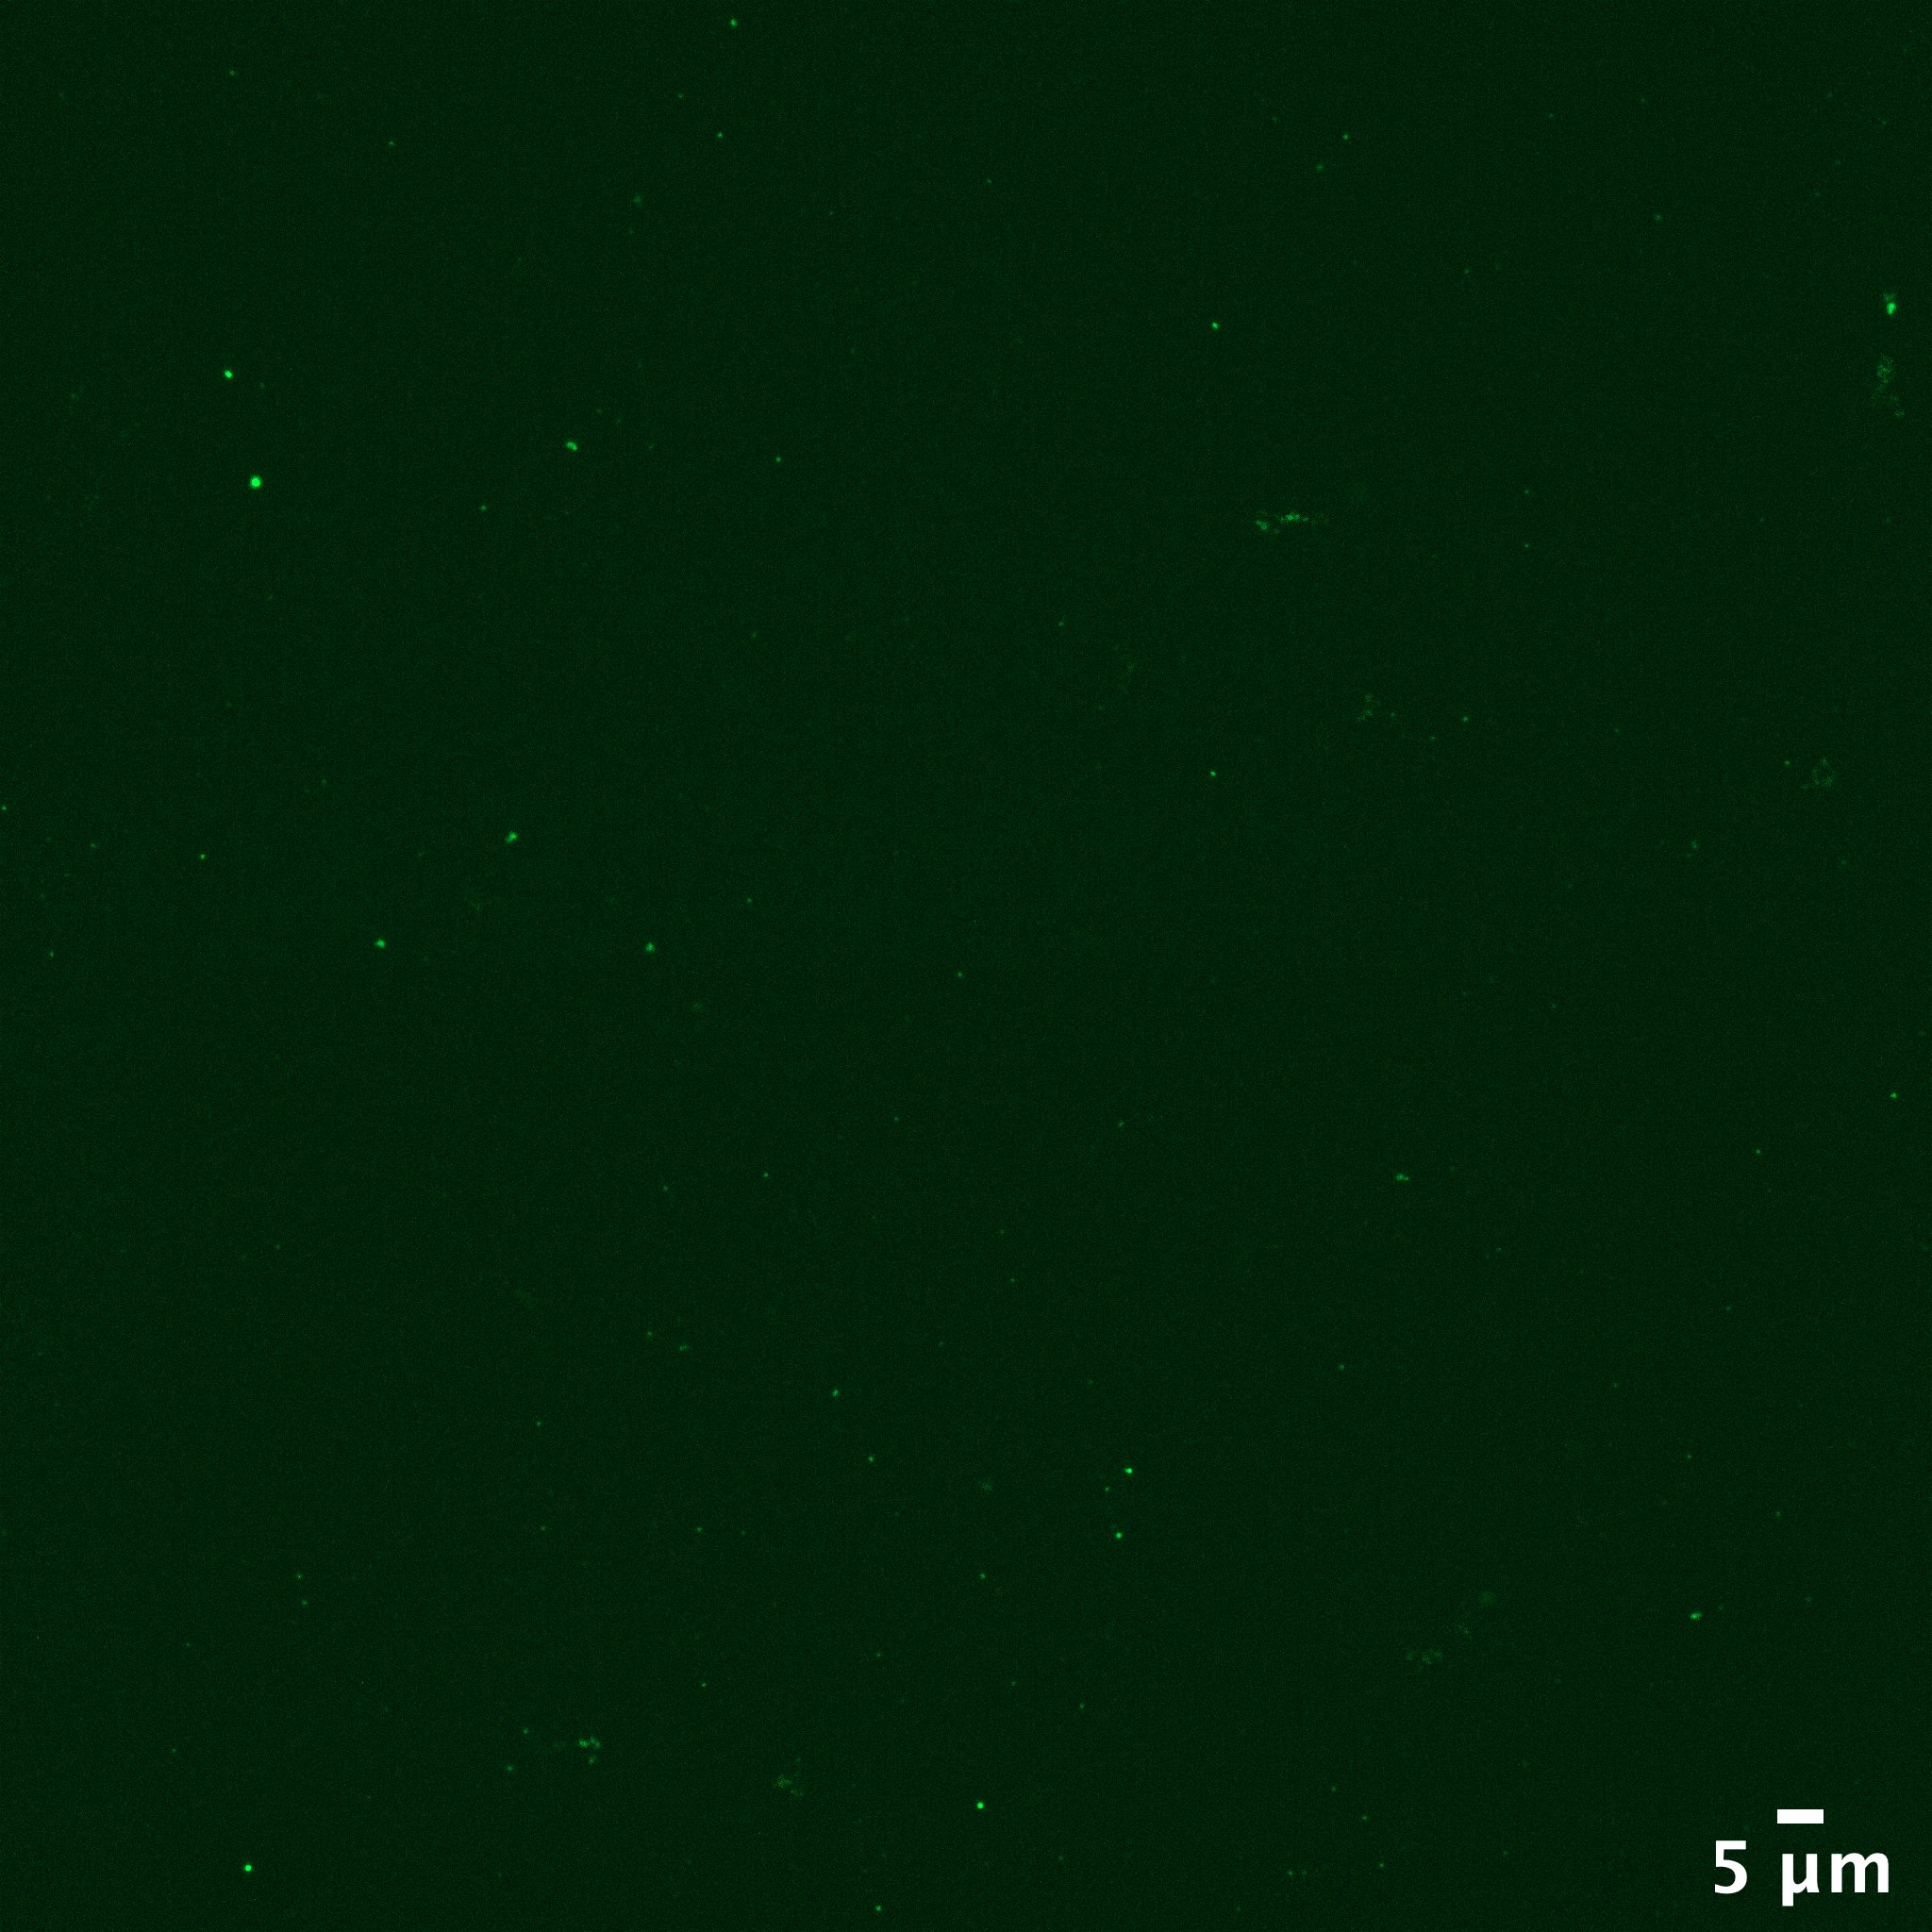
In some cases, TFF experiments will result in air infiltration in the filtrate portion of the tubing due to extensive membrane fouling and a resulting change in membrane resistance. This is likely not the cause of air infiltration in this experiment based on images taken at the membrane surface (Figure 5). There are some potential EVs captured on the membrane but certainly not what would be expected in a case of extensive fouling. It is more probable that air is pulled in from connections at access ports or due to a breach in device sealing.
It’s hard to say if the Rev B device is yet reliable and useful for TFAC experiments. The Rev B device withstood flow and bead capture without leaking like its predecessor, but in the case of EVs the device became compromised. This could be due to the burden placed on the device as it was performing TFF on a diluted plasma sample or this could be due to the small number of tests completed thus far. Additional testing with various solution types will tell us more.