Procedure for labeling BSA with TRITC works
IMPORTANT: I made a mistake, and mistook what was actually Tetramethylrhodamine-5-Iodoacetamide Dihydroidiode (5-TMRIA) for TRITC. 5-TMRIA is another Rhodamine derivative and has similar chemical properties to TRITC, but does not bind to proteins in the same way. The procedure should still work for conjugating TRITC with BSA (in fact, it should work even better,) but it has not been tested. I will be testing this ASAP and will update here when I can confirm that the results presented here are valid for TRITC as well as for 5-TMRIA.) Sorry for any confusion.
UPDATE: See this post. The procedure does, in fact, work for TRITC as well!
A little while back I made this post regarding a procedure for labeling BSA with TRITC. This has become important because in order to do more adsorption tests I’ll need a lot of labeled protein, and the stuff Sigma sells is very expensive. So today I whipped up a batch of the protein solution that’s described in the previous post and tested its fluorescence against background. According to Imagej the fluorescence of the 6mg/mL solution is an order of magnitude higher than background (991 over 91.)
In order to confirm that the TRITC-labeled protein solution is, in fact, a TRITC-labeled protein solution and not just a solution of BSA with some loose TRITC floating around, Jim had me run some tests with what he calls a “flow chamber,” if I recall correctly. The basic schematic is as follows:
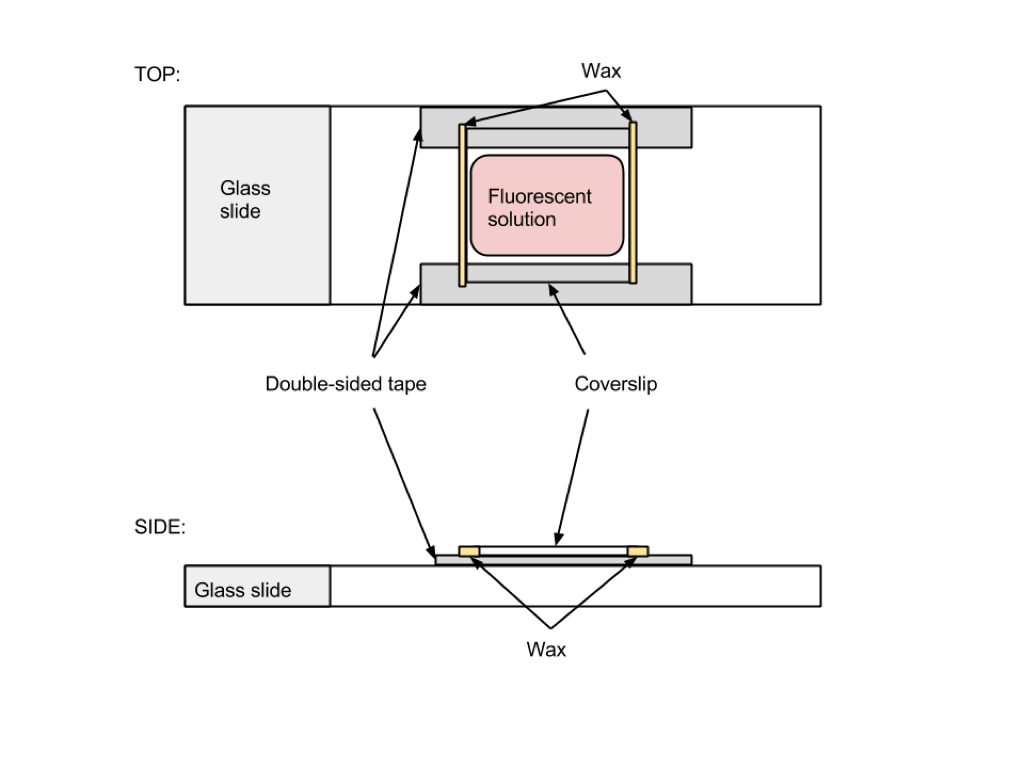
The fluorescent solution is sandwiched between the glass slide and the coverslip, and is only about 20uL of fluid. Melted wax is dried on each end of the coverslip after the solution is pipetted in to seal it.
The test relies on the tendency of the fluorescence excitation laser to “bleach” fluorescent molecules as it excites them. The assembly is placed under the microscope and sits in one place under the excitation laser for ten minutes, with a fluorescence measurement taken every minute. Then, the laser is switched off and a measurement is taken every thirty seconds for another ten minutes. In theory, larger molecules such as proteins will diffuse from the unbleached regions into the field of view much slower than small molecules such as TRITC, and as such the size of molecules will inversely correlate with the rate at which the fluorescence recovers after the ten minutes of bleaching are over.
The data collected match with this theory precisely. Since the maximum fluorescence (that is, the fluorescence before any bleaching, at t = 0) observed in the BSA&TRITC solution was considerably lower than the TRITC-only solution, the fluorescence data depicted in the graph below has been scaled so that “1” represents the maximum fluorescence value of each sample.
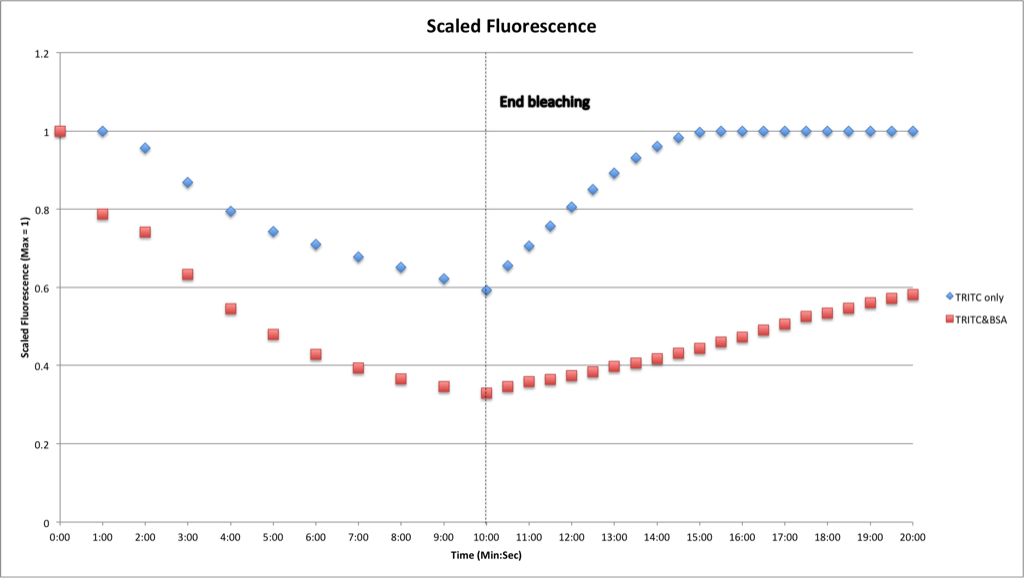
Note that the maximum fluorescence value observed in the TRITC only case was so high that it saturated the microscope, explaining why the fluorescence values appear to recover completely and then plateau perfectly.
The slope of scaled fluorescence value is much higher for the TRITC-only solution than for the BSA&TRITC case, suggesting that the unit of fluorescence in the latter case is considerably larger — that is, a fluorescence labeled BSA molecule.
I will be looking into scaling this process up to produce larger volumes of fluorescent BSA in the laboratory in the near future. Hooray for positive results!

Great job! Basically you did a FRAP experiment. Did you use any ND filter ?