Reviewing Simulation/Experimental Comparison
Here is the most up to date figure that I’ve made to compare the simulated and experimental separation results. I went back through the x-ray crystals and remeasured the longest distances in the molecules. I used the radii to rerun the simulations and plotted them against protein and rhodamine diffusion data. Here are the results:
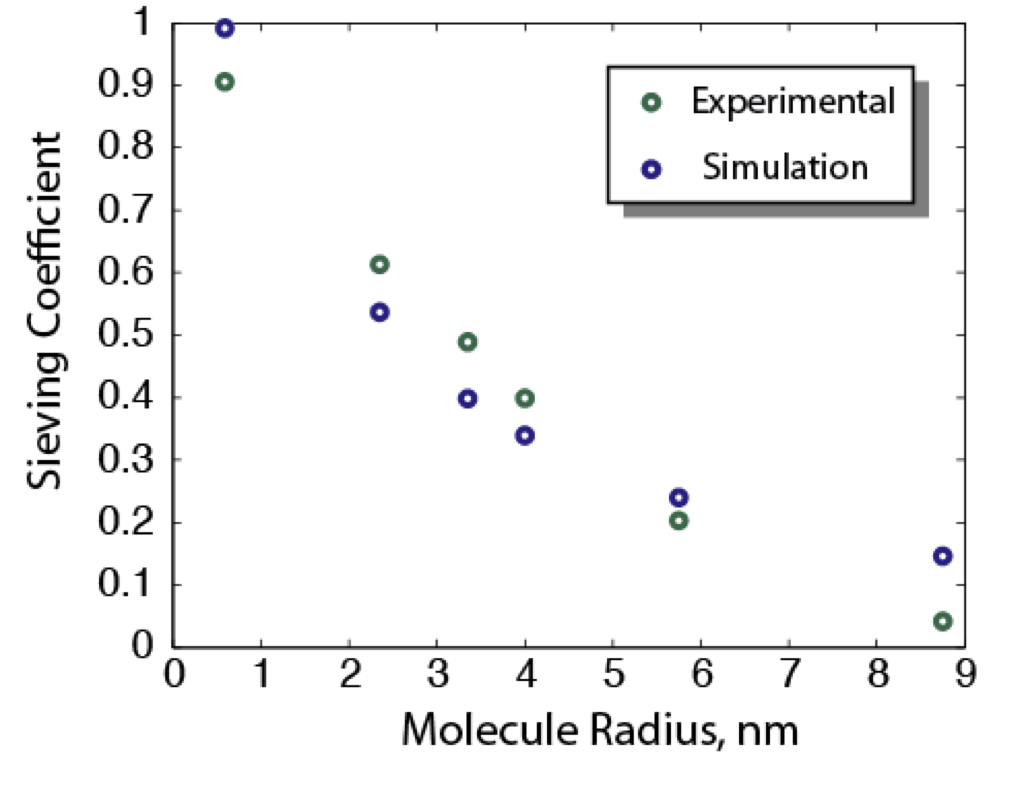
Sieving Coefficient is the filtrate/retentate ratio taken after 24 hours of separation. The agreement appears to be pretty good in this figure. Membrane impact however doesn’t occur until 8nm or larger, so most of these molecules are separated only by the difference in diffusion coefficient. I will work to find larger species and replicates of these trial.
Molecules used are (from smallest to largest): Rhodamine, carbonic anhydrase, ovalbumin, albumin, phosphorylase b, and beta galactosidase.