Check Yourself Before You Wreck Yourself: Quality Control of 0.5 µm Microporous Membranes
For the osteomyelitis project which I have been working on for quite some time now, my collaborators and I have been working solely with 0.5 µm microporous membranes. To ensure that every membrane we work with has pores of the right size and are defect free, the two following protocols were created. The first checks a sampling of membranes upon arrival at UR. The second checks every membrane just before use in an experiment.
Quality Control and Pore Characterization Upon Arrival
Upon arrival at UR, I developed the protocol shown below to assess newly received 0.5 µm microporous membranes.
Protocol
- Once membranes arrive at UR, one chip out of every gel box is taken for imaging
- Each chip taken for imaging is coated with 6 nm of gold using the Denton Sputterer in the SEM prep room
- Once loaded into the SEM, images of single pores are taken using 20 kV power and 140,000X magnification
- One image is taken in each window of each chip
Results
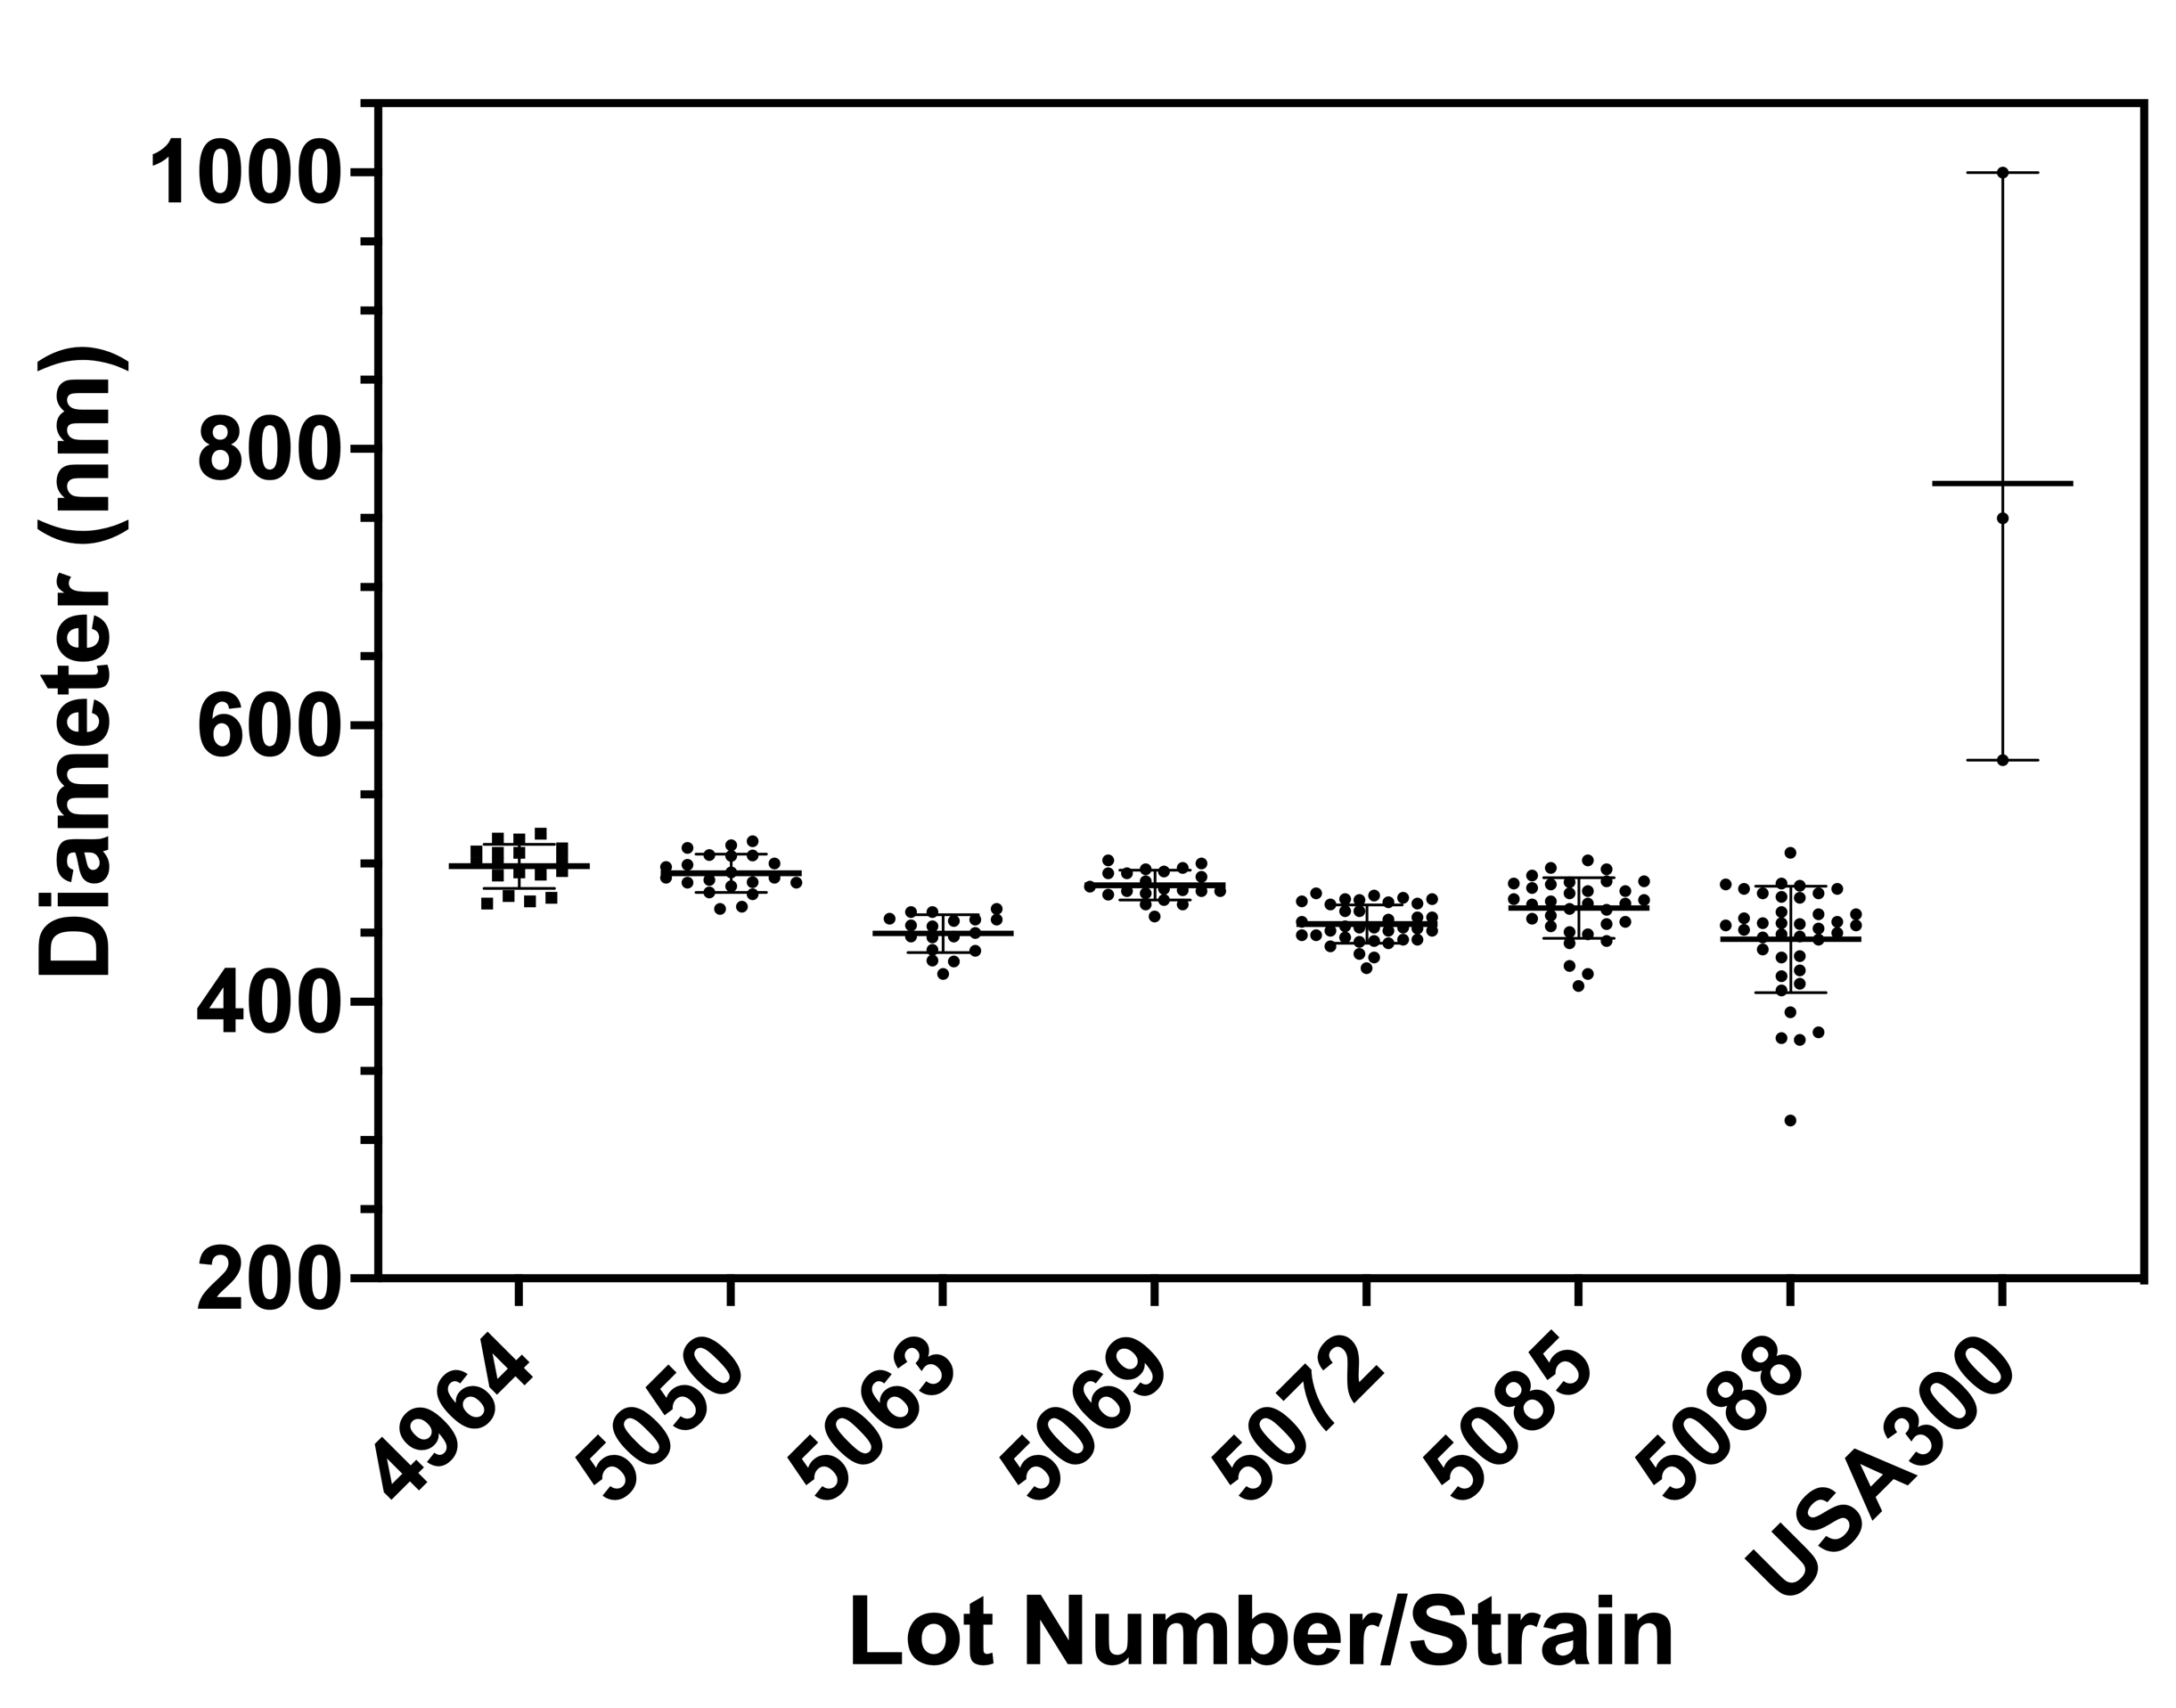
I have followed this protocol for the seven wafers I have worked with during my time on the osteomyelitis project. My results are shown in Figure 1 below, with pore sizes ranging on average from 445.3 nm to 498.1 nm.

Pore sizes have been relatively stable over time. Our most recent Lots, 5085 and 5088, had a wider range than the other lots because some of their membranes contained pores which had the bowl with a hole morphology. The gel boxes which these chips came from were put aside and their chips were not used for any bacteria work. All other membranes were used as we considered a variation of +/- 50 nm off our 500 nm target as acceptable. This belief originated from previous measurements of Staphylococcus aureus which showed that it does not typically get smaller than 600 nm in diameter (Masters, E. A. et al. (2020) Identification of Penicillin Binding Protein 4 (PBP4) as a critical factor for Staphylococcus aureus bone invasion during osteomyelitis in mice. PLoS pathogens. [Online] 16 (10), e1008988–e1008988). The range of bacteria diameters found in this paper are shown in Figure 2 below in comparison to the range of pore diameters across all of the membranes we have received thus far.
Quality Control at the Point of Use
Acknowledging that our initial quality control check could allow some bad chips to fall through the cracks, a step was added to our initial device wetting protocol to empirically determine if the pores of our membranes were in good condition. Our wetting protocol is shown below with the quality control step shown in red.
Protocol for Preparing the µSiM-CAs for Testing
- Thoroughly examine each µSiM-CA device you will use for any defects such as improper sealing between components or broken membranes
- Prepare petri dishes to hold µSiM-CA devices by placing 2 Kim Wipes moistened with sterile dH2O along the perimeter of each petri dish
- Pipette ~15 µL of desired media by inserting the pipette tip into one of the two open ports of the µSiM-CA and depressing the plunger of the pipette; the media should flow from this port through the bottom channel and out the opposite, open port. Remove the pipette tip before releasing the plunger of the pipette to avoid sucking injected fluid back out of the bottom channel of the device
- With the bottom channel wet, block one of the open ports using a 3M double-sided tape sticker and stabilize the devices with clamps around its sides
- Fill the well of the µSiM-CA by pipetting 100 µL of fresh media into it; care is taken to not create air bubbles and/or remove them by by withdrawing injected media and injecting it again until no air bubbles are visible
- In the same manner as above, pipette ~40 µL of TSB media into the open port and look to see the well fill with little resistance. If resistance is appreciable, discard the device and prepare a new one
- Remove all liquid from the well (~140 µL), then add 15 mL of media into the open port
By having this step in our wetting protocol, albeit subjectively, every single chip we use is tested for patency. If pores are substantially occluded, fluidic resistance increases to a point which is noticeably different than a chip whose pores are open. This is shown in the video below which demonstrates the difference between a chip whose pores are open (no occlusion), minimally occluded, moderately occluded and totally occluded.
For demonstration purposes, each condition was artificially created by decreasing the number of open windows there are in three slot 0.5 µm microporous membranes (3 open, 2 open, 1 open and finally a nonporous chip to represent 0 open). As more occlusion occurs, fluidic resistance is higher which can be easily seen as it translates to a longer injection period. Off camera, this also corresponds to a decrease in responsiveness in the plunger of the pipette. If injection rate suddenly does not react to the movement of your thumb as you depress the plunger, this is another indication that the pores are occluded in some manner. Several different users across the labs that use these chips and protocols have caught occluded membranes using this check. An example of a membrane caught with this check can be seen in Figure 3 below.
As demonstrated in the video above, this membrane was caught with about nine others after an appreciable amount of resistance was seen when completing a point of use quality control check. This success story along with several others have led us to believe that together, our quality control in addition to the quality control done at SiMPore is enough to ensure that every 0.5 µm microporous membrane that we test with is of good quality.