Hemocompatibility of pncSi – Complement Activation Studies
This is the third set of studies to assess the hemocompatibility of pncSi. It aims towards a quantitative analysis of the formation of the complement protein C3a in the blood upon interaction with pncSi surfaces.
Biological Motivation: Complement proteins help the functioning of the innate immune systems in clearing away the pathogens from the organism, hence the name ‘complement’. Complement protein C3 plays a central rol in both classical as well as the alternate pathway for complement activation. Upon cleavage, two fragments C3a and C3b are formed; thus estimating the levels of C3a gives us an indirect measurement of its parent protein C3 and helps us to quantify the ‘intensity’ of the complement activation. So this study is to check the levels of C3a formed in blood upon its interaction with different surfaces.
Surfaces Used: Two versions of pncSi are used: plasma treated pncSi and liquid treated PEG-pncSi. DEAE Cellulose is used as a positive control while teflon (fluorinated ethylene propylene – FEP) was used as negative control.
Protocol: A standard SANDWICH ELISA assay is being implemented to assay the formation of C3a protein. Following is a quick overview of the ELISA assay used.
- Freshly drawn blood samples are incubated on the surface for hours at 37C. After two hours, plasma is extracted from the blood by spinning at 1000g for 15 mins.
- Extracted plasma is then added in to the ELISA wells coated with a monoclonal antibody against C3a binding site; this incubation is done at room temperature for around 2 hours.
- A biotinylated polyclonal antibody against C3a (different binding site) along with streptavidin peroxidase is added in the wells. So now the well contains Ab-C3a-Biotin-Avidin linkage immobilized.
- A chromogen is then added in the well which gets cleaved by the peroxidase enzyme producing a distinct blue color. The intensity of the blue color directly depends on the amount of cleavage which is in turn proportional to the amount of C3a on the surface.
- A stop reagent is finally added to stop this enzymatic cleavage to produce a yellow color, with intensity again proportional to amount of C3a. OD measurements are then taken at 450 nm and a calibration curve is generated.
Results and Discussions
A calibration curve has to be generated in every experimentation set up to ensure the efficacy of ELISA assay. A normal calibration curve looks like follows.

Using this calibration data, one can find out the concentration of the unknown samples from their OD values. As expected, the positive control, DEAE Cellulose, gave higher values of C3a as compared to the Teflon surfaces acting as a negative control. The PEG treated pncSi gave almost similar values to the onces from Plasma treated surfaces, both values lesser than DEAE cellulose but higher the negative control. ANOVA test indicated all the four values are statistically different from each other. Following figure summarizes the results.
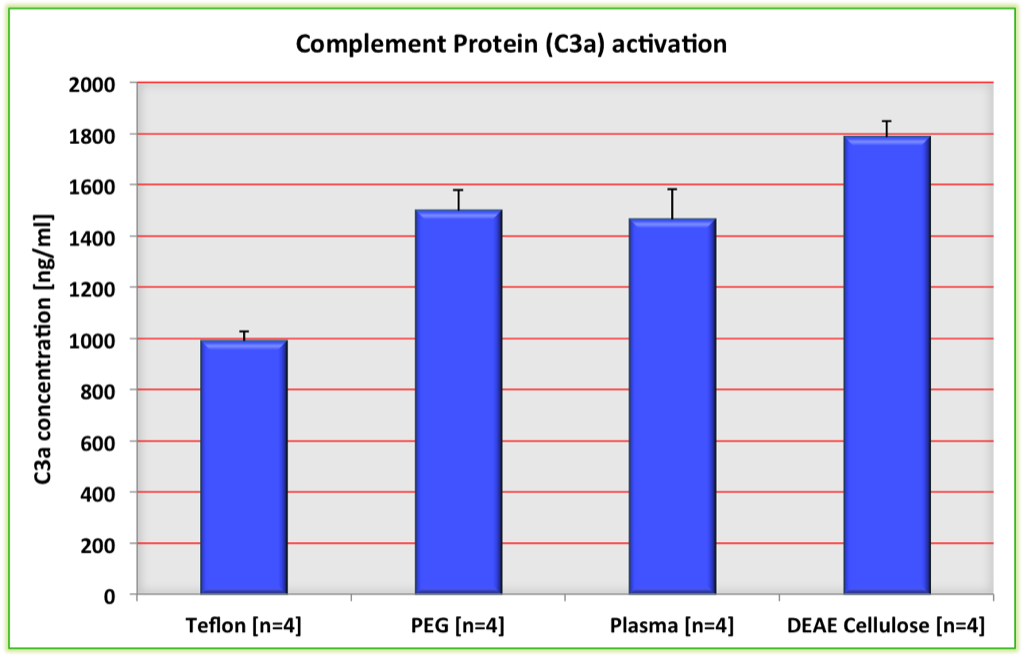
The PEG-pncSi surfaces were treated with PEG almost 1.5 month back; so there could a possibility of PEG layer wearing off from the surface of wafer, thus reducing the anti-fouling property of the membrane. Nonetheless, even the plain-plasma treated surface can cause lesser C3a activation as compared to DEAE cellulose is a good start for further investigation about improving surface chemistry of PEG treated wafers.