EO Pressure/Flow Relationship
When we submitted the EO paper way back one of the reviewers made the following comment …
What is the “head pressure” P_max, i.e. the maximum back pressure that would stop the pump? For any linear electrokinetic phenomenon such as EO pumping, the flow rate decreases linearly with backpressure until a certain point (“head pressure”) where the net flow rate is zero. (Of course, EO flow still goes forward, but it is then cancelled by pressure‐driven flow in the opposite direction.)
As explained by Yao & Santiago as cited (and many others), the basic relation is
Q/Q_max = 1 – P/P_max
I believe that what the authors reported is Q_max, the maximum (unassisted) flow rate, which occurs at zero back pressure, P, and they get some nice improvements in this number versus prior pumps. However, this can be misleading, since the same strategy of decreasing the pump thickness also reduces P_max, which scales linearly with thickness (assuming Darcy flow). Prior EO pumps with thicker porous media easily achieve 50atm pressures, but I suspect that here the pressure is vastly smaller. This number should be calculated, and ideally measured directly ,since it is another crucial measure of pump performance. There is not much use for a pump that drives a local flow but cannot produce the pressure needed to sustain a long‐range flow into a reasonable hydrodynamic resistance. For example, in subcutaneous drug delivery, once needs around 1% atm=1kPa, and for a platform technology in microfluidics, as suggested by the authors, one needs similar pressures to achieve useful flows around mm long microchannels or to push down an elastomeric valve. I have not plugged in the numbers myself, but naively, I would expect that if they reduced thickness by 200x, then P_max dropped by the same number, which might be OK (maybe 10kPa).
Jirachai (Borkholder’s group) has spent the last 8 months investigating the stall pressures of our membranes. His results look like this.
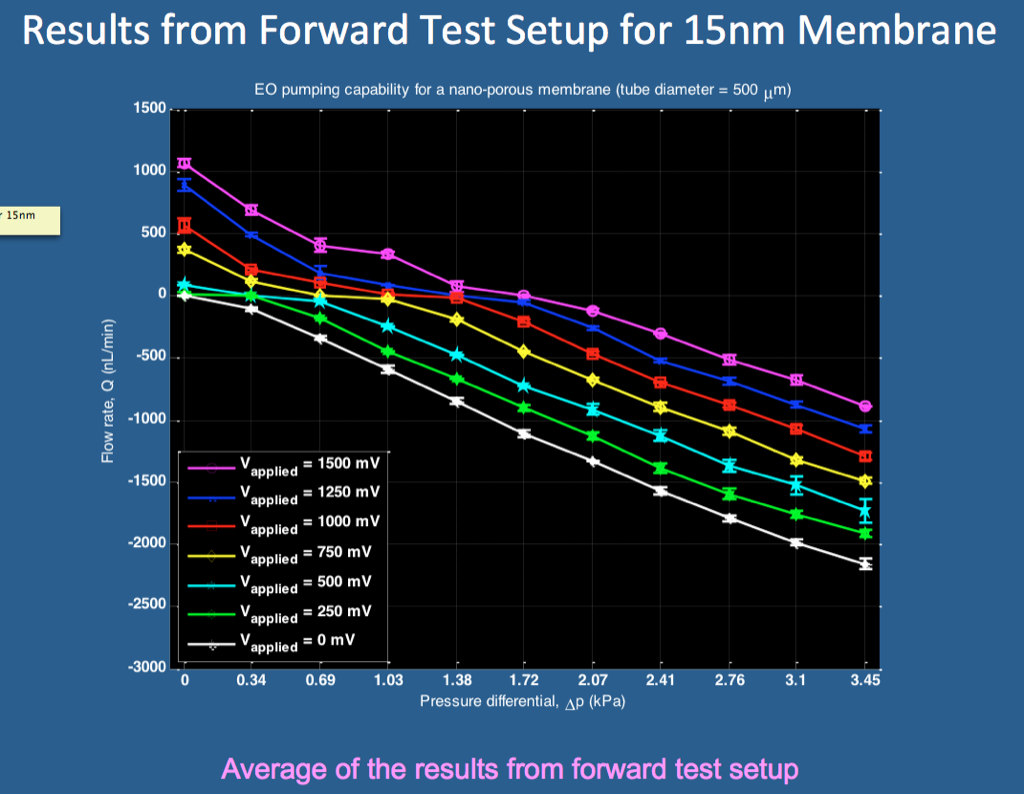
Jirachai determined that the inflection point near stall was due to the deformation of the water/air interfaces. Analyzing this data in the linear region, Jess developed the following figures …
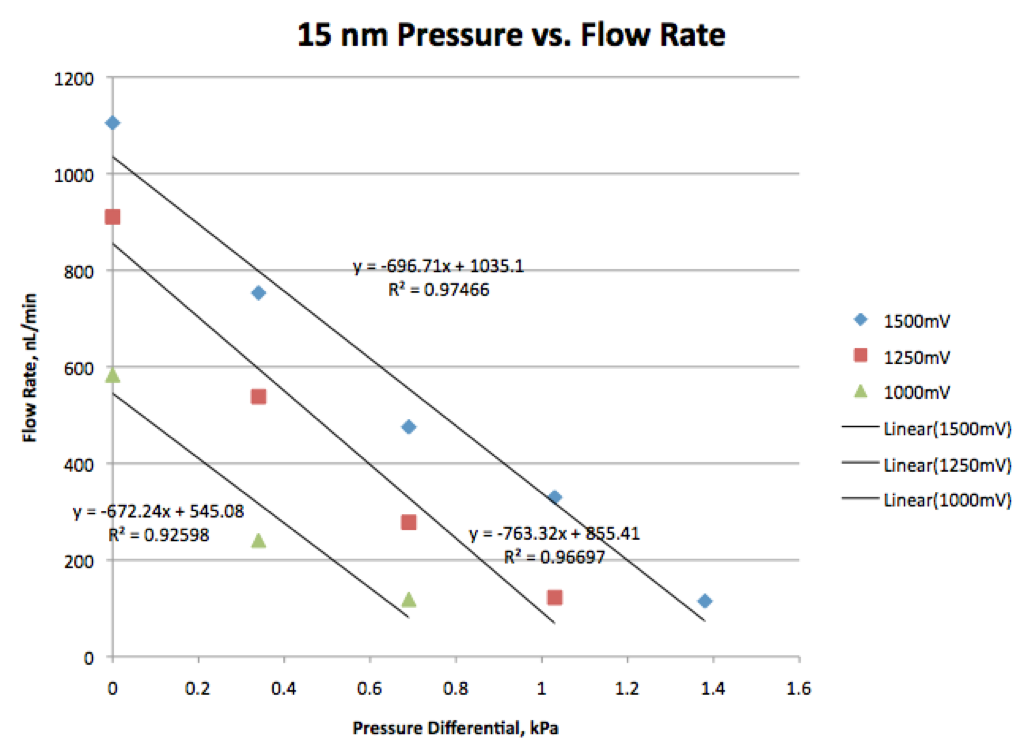
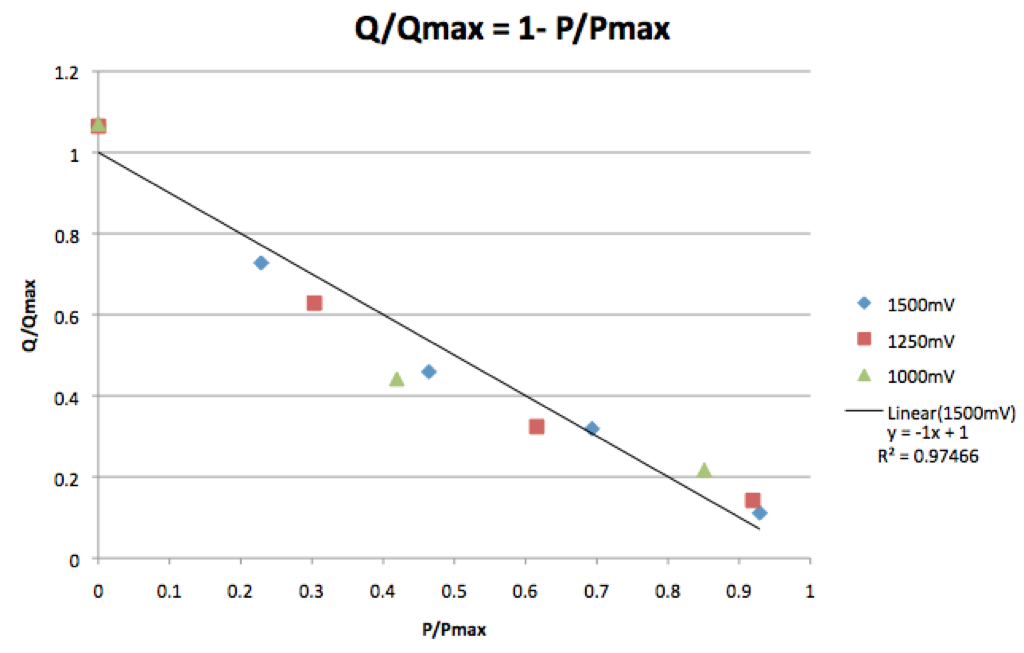
Not surprisingly, the reviewer was right. Our stall pressures are not very high and the relationship he/she suggested clearly holds regardless of voltage. We have not done these experiments with higher active area but we have investigated thicker material.