Bad to the Bone: Hydroxyapatite Coating Silicon Nanomembranes
In support of the bone infection studies done in the Schwarz lab at URMC, I have recently been tasked with coordinating a new collaboration with Dr. Yates lab in the Chemical Engineering department. The goal of this collaboration is to establish a method to coat our membranes with hydroxyapatite crystals. Two different methods were attempted, with electrochemical synthesis providing the best results.
Background
After completing extensive research using our membranes as an in vitro platform for S. aureus propagation studies, the Schwarz lab wants to take the chip platform to the next level. While previously they used our bare chip as the substrate for their cell studies, they would now like to complete the same studies but on membranes which exhibit an inorganically equivalent bone like surface. In order to achieve this we have set out to determine if we can effectively coat our chips with hydroxyapatite. Hydroxyapatite is the crystalline form of calcium apatite, and it is the main inorganic constituent of human bone.
Control
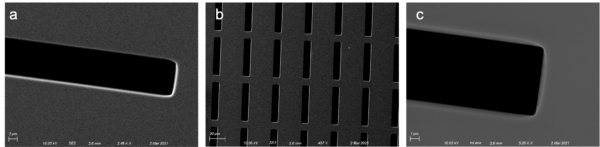
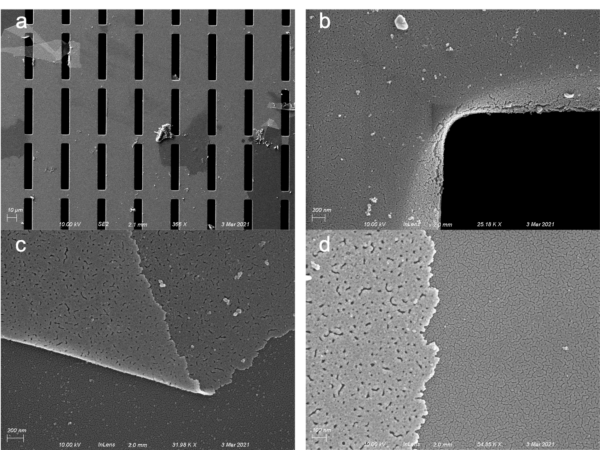
For all of the following experiments, we used 8 um slit chips. As a control, the following Figure shows SEM images of a bare 8 um membrane. These can be used as a comparison for how effectively the following methods coat the membrane in hydroxyapatite.
Dip coating
The first method we used was dip coating. This involved creating solutions of hydroxyapatite particles, dipping our chips into them and withdrawing them at a controlled rate. Dr. Yates suggested we withdraw the chip out of solution very slowly, starting at a rate similar to evaporation of our solvent. To maintain a controlled withdrawal rate I created a setup which used the bottom of a cut in half eppendorf tube and a syringe pump. I would fill the eppendorf bottom with the hydroxyapatite solution and insert a tube attached to a syringe pump. I would then submerge the chip that I wanted to coat in the hydroxyapatite solution within the eppendorf bottom. Once in position, I would set the syringe pump to withdraw the hydroxyapatite solution at a set flow rate which I dubbed my withdrawal rate. After the hydroxyapatite solution was withdrawn to the point where the now coated chip was no longer submerged, I would retrieve the chip and image it. The solvent and withdrawal times were the main factors that contributed to a good or bad coating for their evaporation time and particle surface supply respectively.
10 uL/min withdrawal rate, Water solvent
I initially attempted to coat a chip at a 10 uL/min withdrawal rate using an aqueous nanoparticle solution. I used <200 nm hydroxyapatite nanoparticles dispersed in water at a 5% w/v concentration. The resulting coating was not uniform or widespread. The result looked so bad that I did not even bother imaging on the SEM.
1 uL/min withdrawal rate, Ethanol solvent
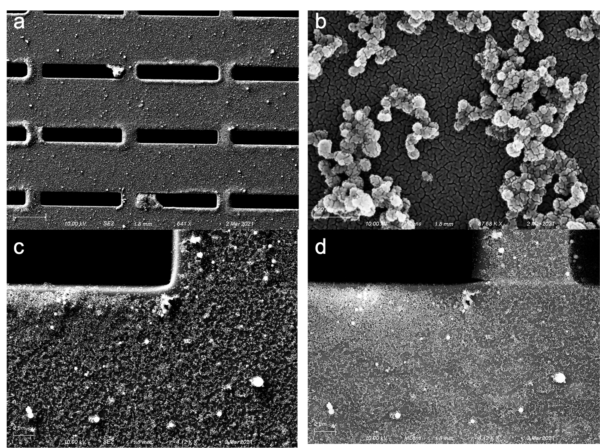
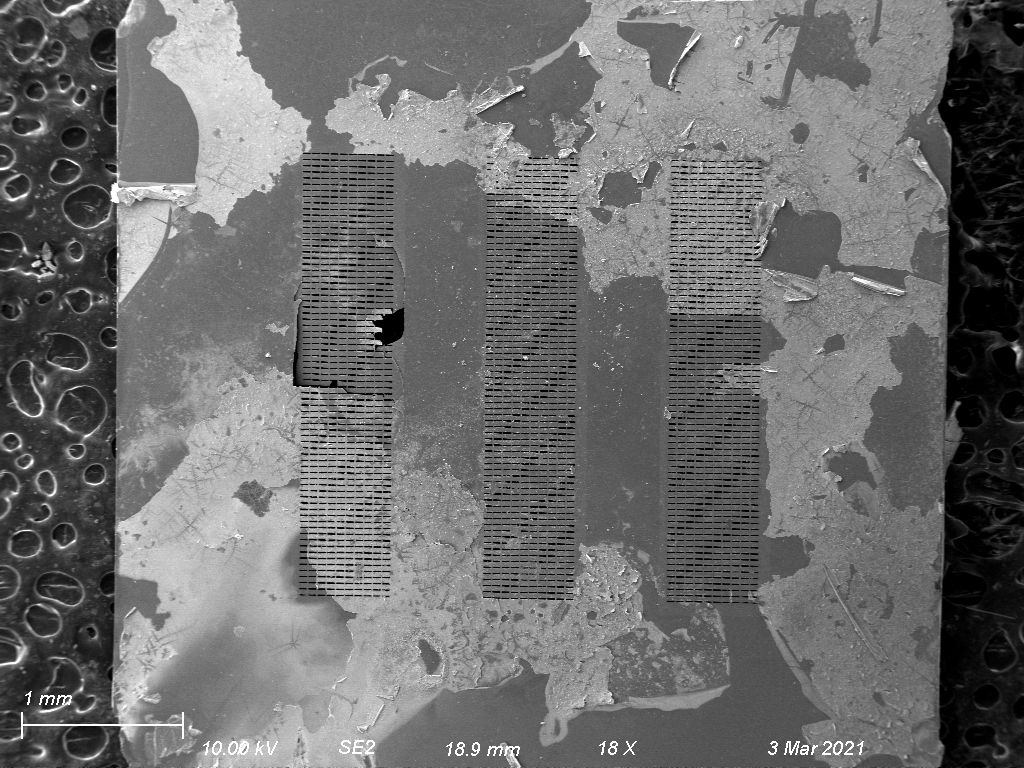
My second attempt was at a slower withdrawal rate (1 uL/min) while using a nanoparticle dispersion in ethanol. This also used <200 nm hydroxyapatite nanoparticles at a 5% w/v concentration, but this time in ethanol. Shown in Figure 2, my results were much better. The coating ended up being fairly thick, and uniformity was decent across all three slots of the chip. The bottom of the chip had a very thick coating which occluded some of the pores, so I decided to try a similar approach at a slightly faster withdrawal rate.

5 uL/min withdrawal rate, Ethanol solvent
Using the same exact approach as before, I exposed a different 8 um slit chip to a 5% w/v ethanol solution of <200 nm hydroxyapatite nanoparticles at a faster withdrawal rate (5 uL/min). The images are shown in Figure 3 below. This coating was thin enough where it did not occlude many of the pores and it also had good uniformity across the chip. If we were to move forward with this method, something very similar to these conditions would be ideal.
Electrochemical Synthesis
This approach was completed by a graduate student in Dr. Yates lab, Rashmi Ghosh. Their lab specializes in the electrochemical synthesis of hydroxyapatite particles which is why we reached out for their expertise. I would gold coat (100 Angstroms) the chips in order to make their surface more electrically conductive and hand them off to her. Their method for hydroxyapatite crystal formation is as follows:
“During the electrochemical deposition of hydroxyapatite (HA) crystals, a (25 × 25 × 0.127 mm3) Pt plate was used as the anode and the membrane chip was used as the cathode. The electrolyte solution was prepared by mixing 138 mM of NaCl, 50 mM of Tris(hydroxymethyl)aminomethane, 0.84 mM of K2HPO4, and 1.3 mM of CaCl2.2H2O in water. The pH of the electrolyte solution was adjusted to 7.2 using concentrated HCl. A distance of 10 mm was maintained between the two electrodes throughout the reaction. The electrochemical deposition of HA crystals was carried out at a temperature of 95 °C under continuous stirring conditions. A constant current density of 12.8 mA/cm2 (w.r.t the Pt electrode) was passed for 5 min for the successful deposition of uniform layer of HA crystals. After deposition, the sample was rinsed thoroughly with deionized water and dried at atmospheric conditions.” This is referenced in the following paper: Ghosh, R.; Swart, O.; Westgate, S.; Miller, B. L.; Yates, M. Z., Antibacterial Copper-Hydroxyapatite Composite Coatings via Electrochemical Synthesis. Langmuir 2019, 35 (17), 5957-5966.
This specific method is what produced the results shown in Samples 3 and 4. Samples 1 and 2 follow the same method but use different current densities or deposition times.
Sample 1
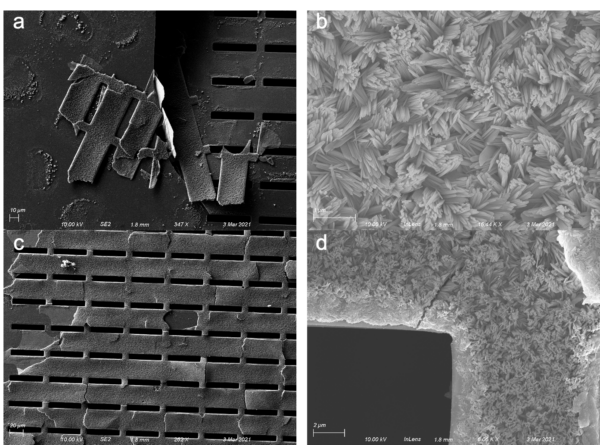
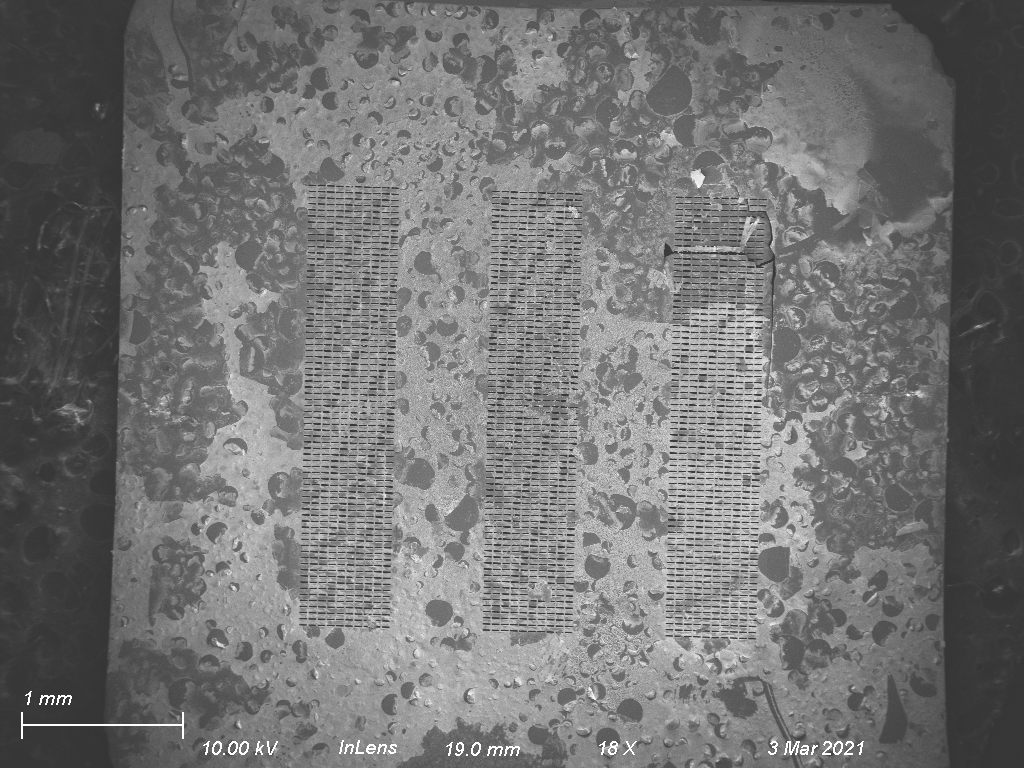
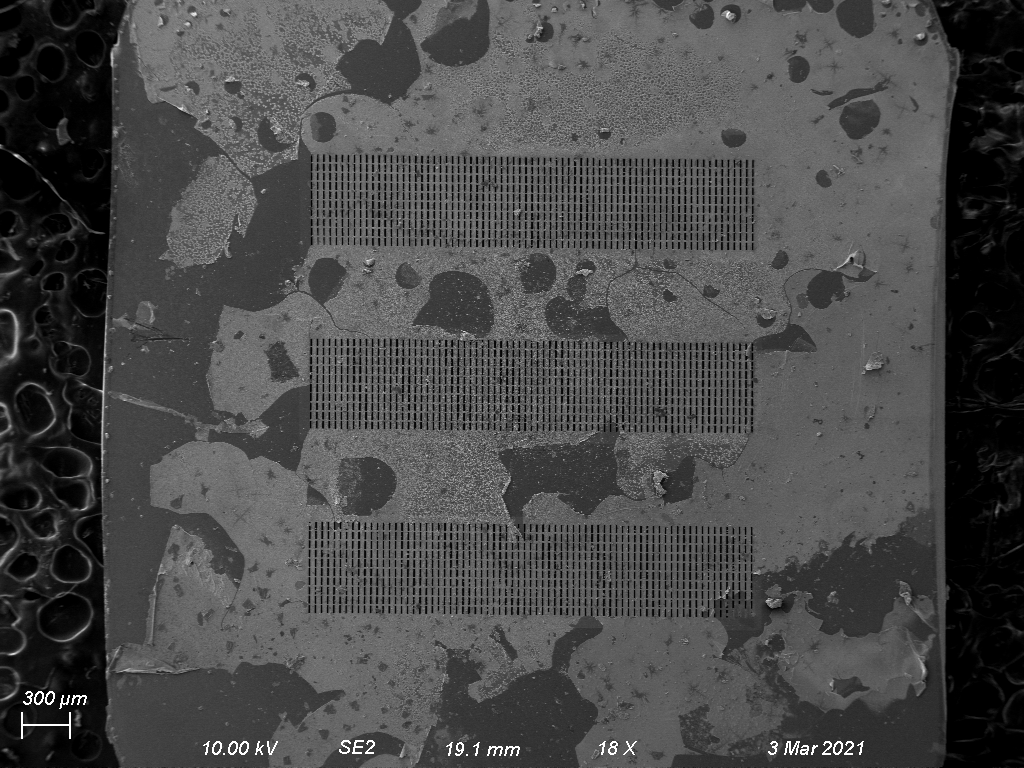
Shown in Figure 4, sample 1 had a thick coating of hydroxyapatite crystals deposited on its surface. Despite this thick coating, it is also showed that hydroxyapatite crystals did not coat the sidewalls of the slit pores. This could be a problem for our bone model application. Figure 5 shows an SEM image of the entire chip shown in Figure 4. This image reveals how widespread the crystal coating is. It is thought that the circular bare spots on the chip were created after bubbles formed on the surface during the electrochemical synthesis process.

Sample 2
Shown in Figure 6, sample 2 also had a thick coating which did not coat the sidewalls of the pores. Notably there seems to be two different crystal types synthesized: an initial flat crystal structure and three dimensional crystals which grow out away from the surface. Figure 7 shows the coating across the entire chip, revealing that it is widespread but with larger parts of the membrane uncoated than in sample 1.

Sample 3
Figure 8 shows that sample 3 has a thinner coating of crystal which coats the sidewalls of the pores of the chip. This coating exhibits the same two crystal structures as are in sample 2. While the crystal coating is better where the chip is coated, the overall coating is not as widespread across the entire chip, shown in Figure 9.

Sample 4
Figure 10 shows that sample 4 had a coating unlike the three other samples. In some areas a very thin coating could be seen, but the coating did not have a similar morphology to the other samples crystal. Figure 11 also shows that this coating was not widespread at all. It is thought that despite the fact this chip underwent the same protocol as sample 3, crystal synthesis did not occur for some reason. At the moment we believe the coating that is shown is this chip was just precursor material.

Conclusions and Future Directions
Both dip coating and electrochemical synthesis proved to be effective methods of coating our membranes with hydroxyapatite crystals. Dip coating is easier, but the coatings are probably less stable. Electrochemical synthesis makes stronger coatings, but some optimization needs to be done to fine tune the method. Optimization will be done by changing the amount of gold on the chip surfaces (changing their conductivity) and by changing current densities and deposition times within the electrochemical synthesis process. Further analysis can be done on the crystal structure using Energy Dispersive X-ray Analysis (EDAX) which can tell us if the crystals we are looking at are truly hydroxyapatite or if they are precursor materials.