Assessing the Capacity of Ultrathin Microporous Membranes
As part of my thesis (and a tie-in to the microplastics research our lab has been conducting) I’ve been working on creating a measure of membrane capacity.
A robust way to do this involves using microporous chips and polystyrene beads. Previous experiments on 8 micron slit membranes have shown that phosphate buffered saline (PBS) and DI water can be forced through a membrane in a dead end flow mode via syringe pumps at high volumetric flow rates (up to 6 ml/min) with no adverse effects. During these experiments, pressure monitoring systems indicated no rise in transmembrane pressure (TMP) either.
This suggests that membrane capacity experiments can be performed by introducing a fouling material (such as polystyrene beads) and assessing pressure changes in a microfluidic system featuring microporous membranes.
Setup:
The microfluidic system being used is the exact same as the one I’ve been using in prior experiments, its designed for tangential flow filtration (TFF) but can be easily adapted to dead end filtration as well.
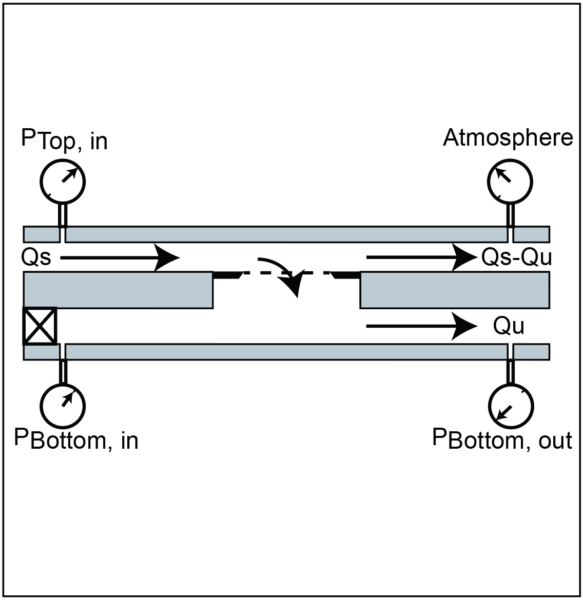
In this case, the tangential flow element (Qs – Qu) is zero. The expected behavior of this system in a fouling mode can be summarized in the following graph (noting arbitrary y axis of pressure and arbitrary x axis of time).
 As beads collect on the surface of a membrane, resistivity will go up resulting in a higher TMP. Eventually the system will reach its breaking point and either fail from gas intrusion due to high pressures or membrane bursting. Of course, reality is often more complicated and this figure turned out to be bad intuition.
Mathematical Modeling and Theory:
To start, I first created a mathematical model of an 8 micron slit membrane and assumed the beads being used in actual experiments to have a nominal diameter of 10 micron.
Knowing that there are exactly 504 slits available on an 8 micron slit membrane, and that each slit has a long axis measuring exactly 50 micron, an 8 micron slit membrane can hold exactly 2520 10 micron beads in its active area. For all further discussion, this constitutes constitutes “100% occupancy” even though the device is still permeable and can still accumulate beads on its surface (more on that later).
The first part of creating this model was generating an array consisting of 504 empty elements, each element representing a slit on the membrane. I then created a decision tree of 5! or 120 permutations that filled each “slit” via a pseudorandom process with numbers representing what order the particles fall in place on the membrane surface. This is assuming 5 maximum “parking” locations, no slipping, and guaranteed pore contact. Here’s an example histogram of particle parking order.
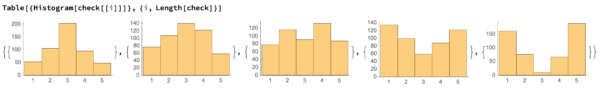
The first histogram shows what “parking spot” each slit filled first, the second shows the second spot filled, etc.
While this is occurring, my model is also iteratively calculating the resistivity of the membrane as particle falls in place. Note that the model assumes a flow rate of 2 ml/min and 50ml of fluid to be used, giving us 25 minutes of data generated. It also assumes that the particles that are blocking the slits are squares. I’ll skip talking about the rest of the code to save some time.
In summary, we’re left with this TMP graph from the model:
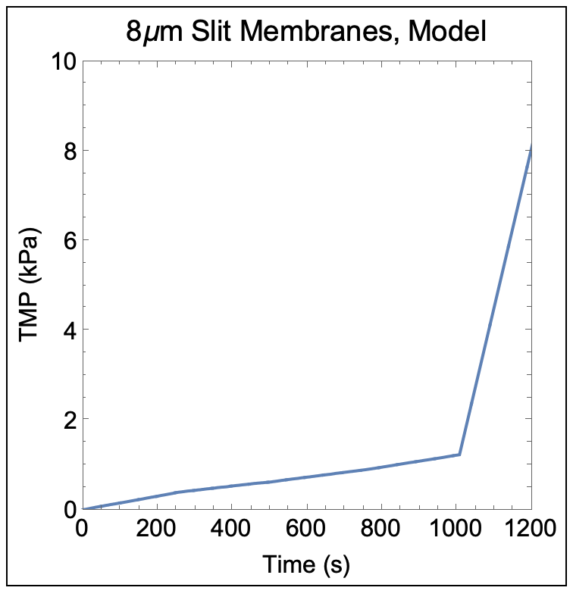
That’s very different from my initial assumptions. Here we note a pressure inflection point occurring at t = ~1000 s. At this point the model has an occupancy of about 80%.
The next step is to see if this occurs in real world data too.
Experiments: 8 micron slit membrane
For the 8 micron slit membranes, experiments were performed with bead concentration increasing in order of magnitude. The beads were suspended in 50 ml of PBS.
In summary:
3x trials of 2.8k Beads
3x trials of 5.7k Beads
3x trials of 28k Beads
3x trials of 280k Beads
First lets discuss the 2.8k bead experiments. Here’s a graph of the average result.

This behaves roughly similarly to the model, the individual experiments have slightly varying inflection points but in general after 700 seconds the pressure rise increases dramatically.
Here’s a video on an experiment:
The 5.7k results:

And video:
(upload error) 🙁
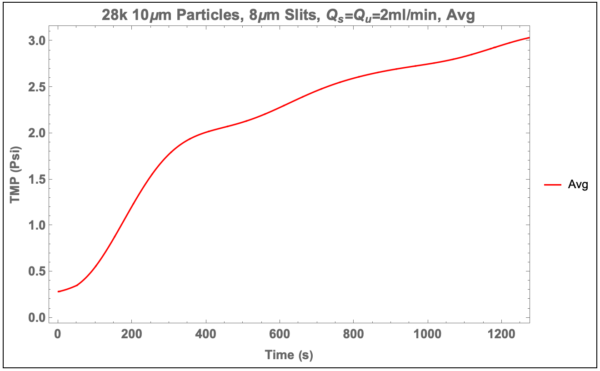
The 28k Beads Results:
And video:
The 280k beads test led to almost instant fouling.
In summary:

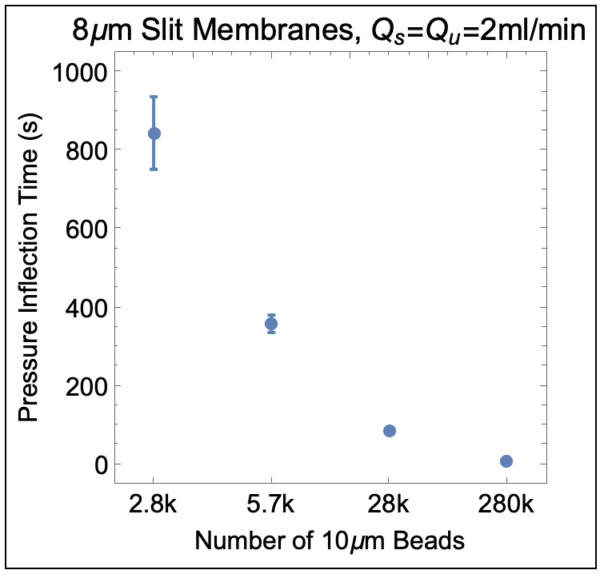
These results seem to point towards a capacity of roughly 60% before rapid pressure rise.
Experiments: 3 Micron Circle Membranes
To see if pore geometry plays a role in capacity, a small number of experiments were performed using circular pore membranes. These membranes had nominal 3.4 micron diameter beads incident upon them. All tests were done with 10ml of PBS.
Given the high porosity of these membranes, approximately 100k beads were used to accommodate the roughly 80k available pores.

For these experiments, the capacity roughly works out to: 81%
Additional Data: 0.5 Micron Long Slit Membranes
These are similar to the 8 micron slot membranes, however they’re twice as long. Experiments are being conducted with nominal .87 micron diameter fluorescent beads. While additional experiments are in progress, there is some data to share. Note that there are 90k spots available on this membrane and bead samples were prepared with 100k beads in 10ml of PBS.
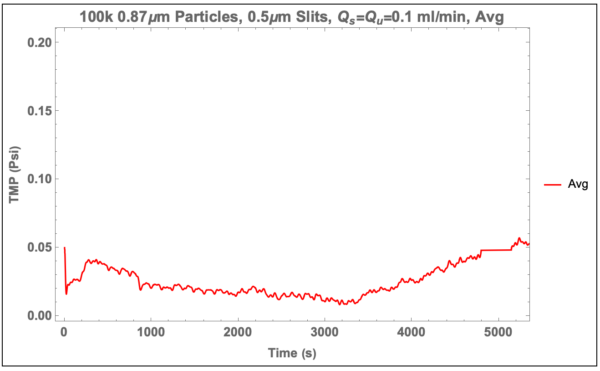
There is a subtle increase in pressure at ~3300 seconds, which translates to about a 62% capacity for the long membranes.
More data on these experiments will arrive shortly.
That is all for now, I’ll post updates as they come.