ALine for EV Capture
ALine Capture Device
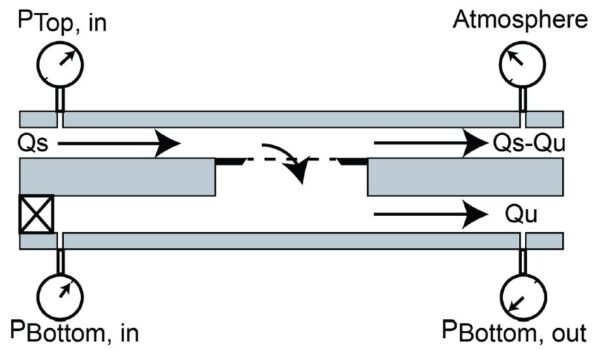
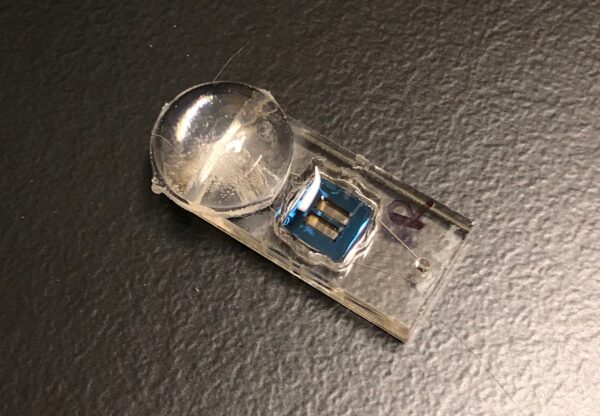
In this post I will go over some of my recent work that is a continuation of Kilean’s research concerning extracellular vesicle (EV) capture and characterization. In the past, this was done using a tangential flow filtration (Figure 1) scheme and clamped devices featuring nanoporous membranes (Figure 2).

These devices are straightforward to use, however, there is likely some degree of variability running experiments under this format. Additionally, the capture portion of these experiments requires 40 minutes to process ~1 mL input volumes and two syringe pumps to control flow rates. In an effort to increase throughput I have attempted to modify the capture portion of experiments by carrying it out in ALine devices (Figure 3).
By placing a bumper on the bottom channel outlet we have effectively created a means for dead-end filtration since any input volume will be forced across the membrane. Modified ALine devices ultimately allow for capture from very small input volumes (40 uL) that takes place in seconds. Following capture, membranes can be imaged in ALine devices which should provide a benefit in terms of sample loss due to the amount of manipulation done to the membrane in between capture and imaging. Under the clamped device format, devices had to disassembled and the membrane chip must be recovered and finally submerged in a petri dish full of buffer solution.
Images
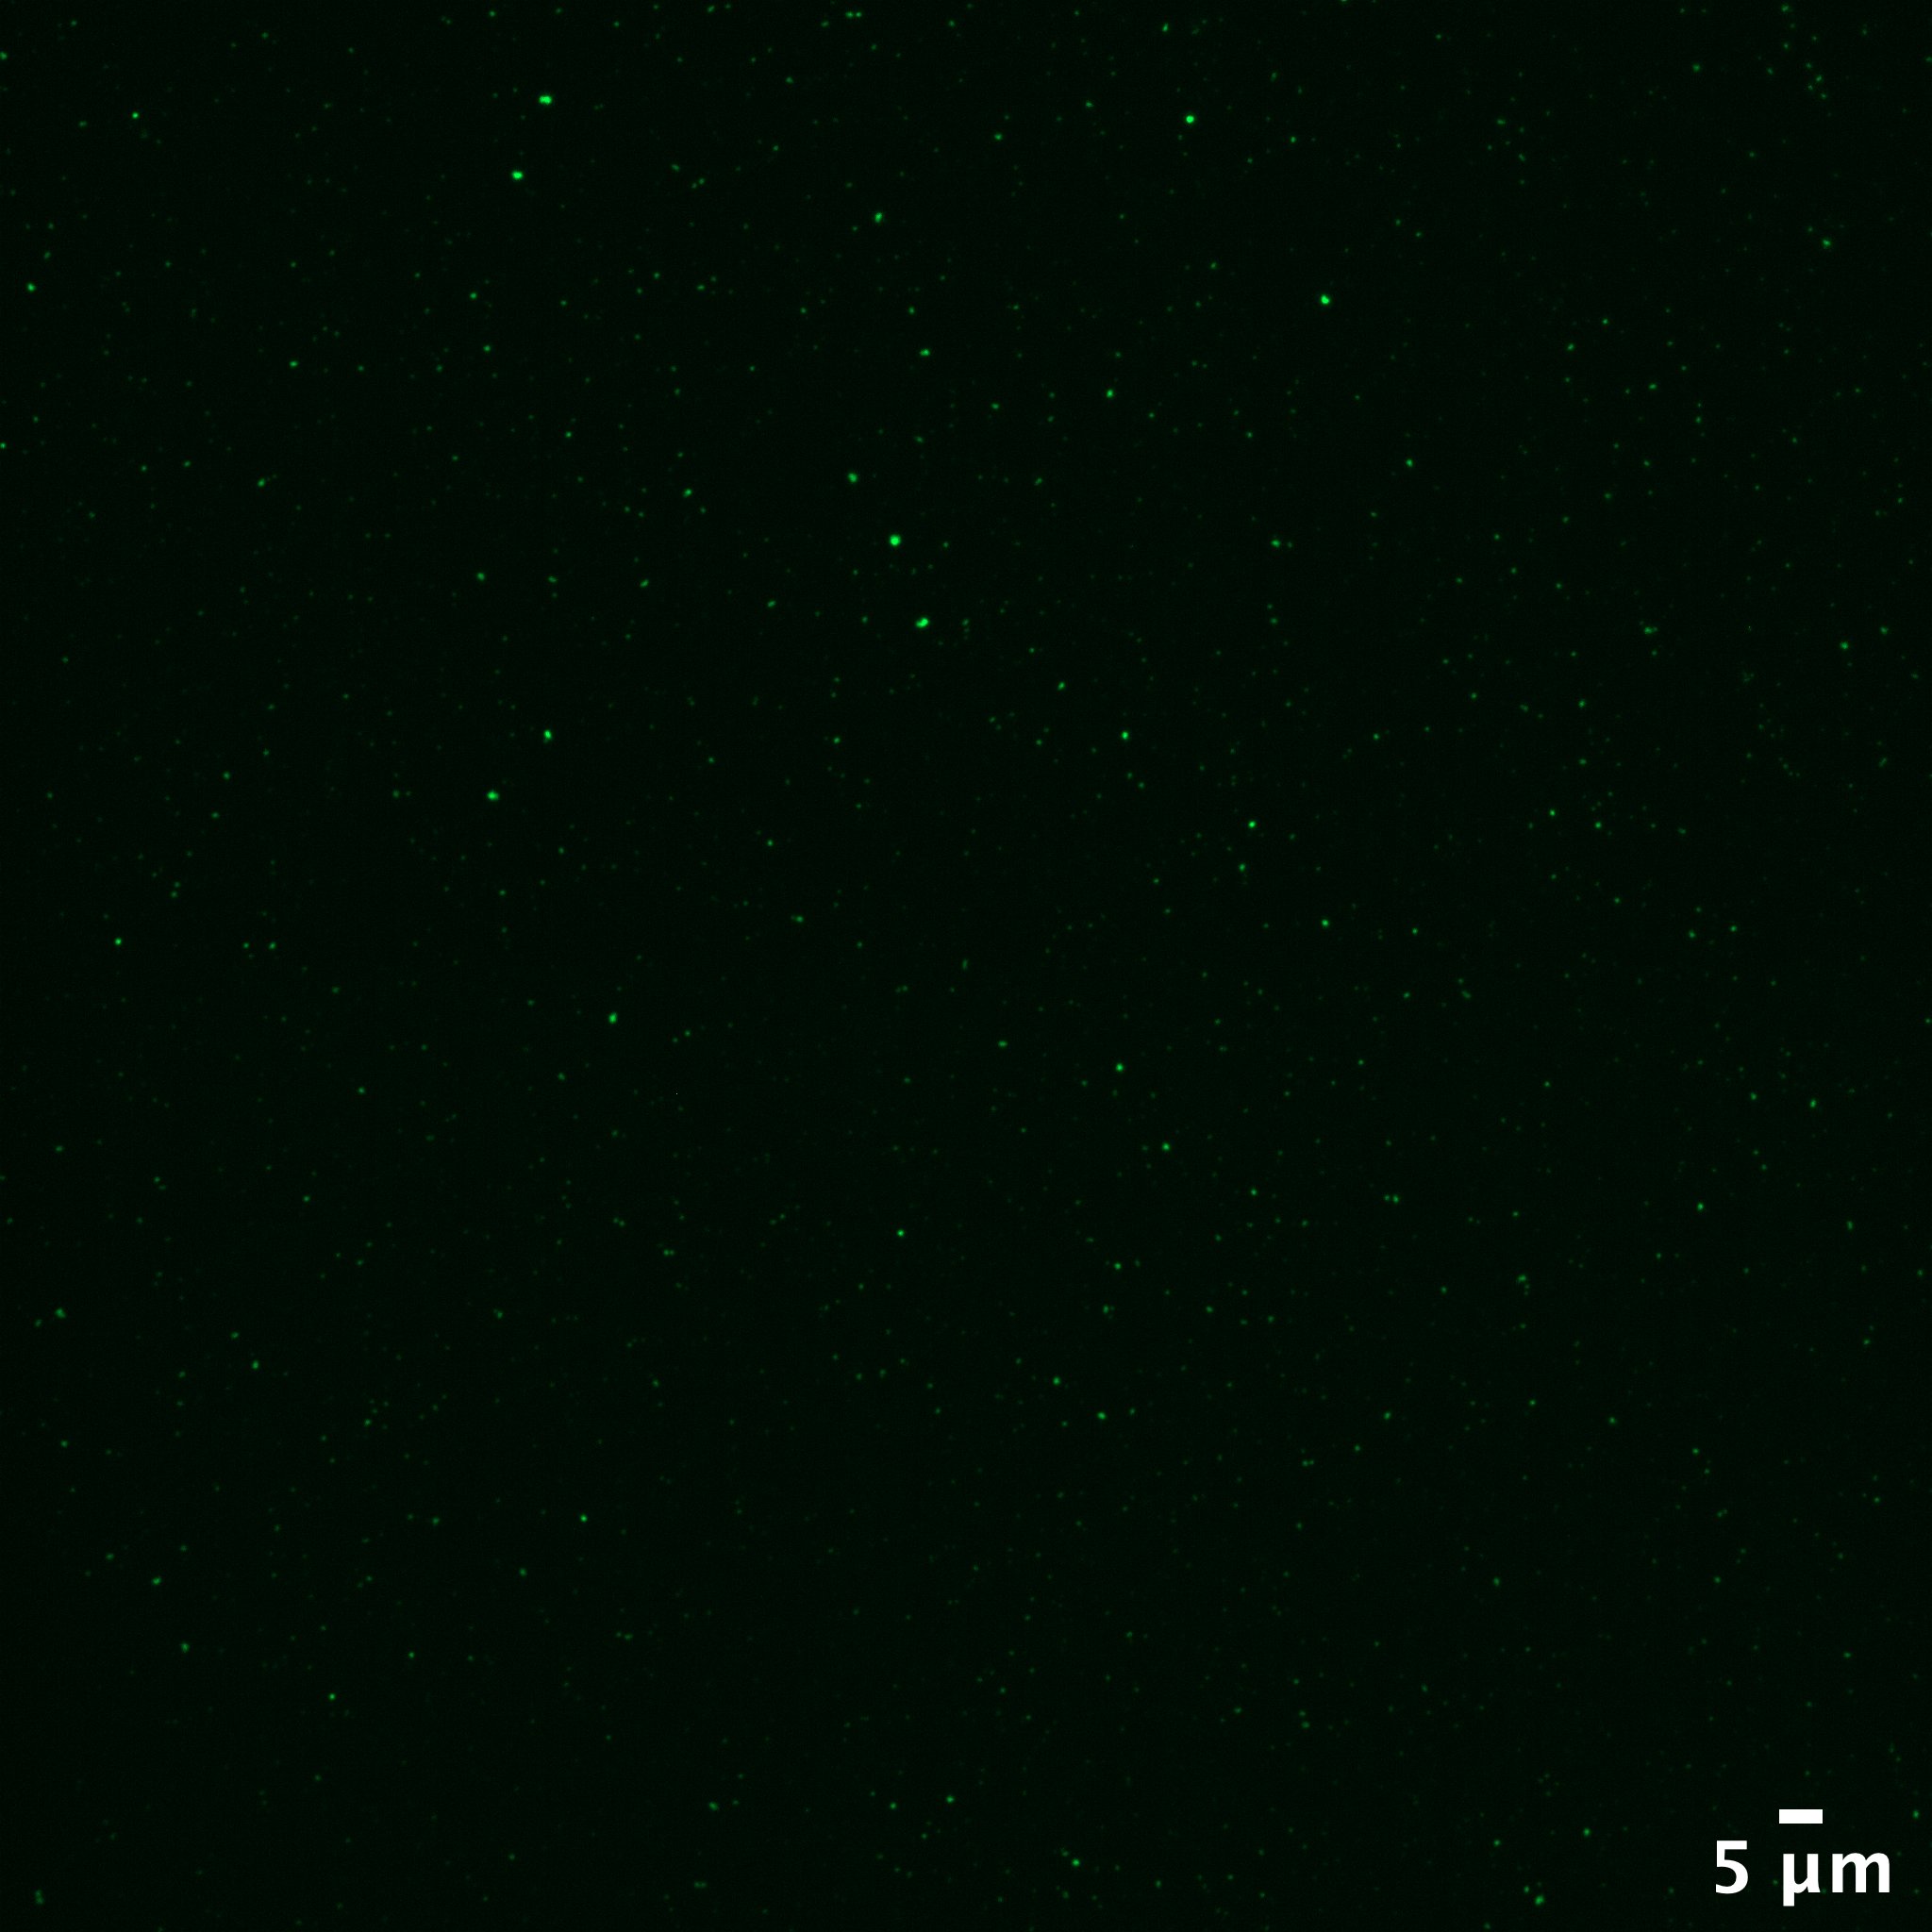
We first looked at capture with 100 nm beads at ~10^5 concentration (Figure 4).

After counting and accounting for total membrane area we can back-calculate input concentration, which is actually closer to 10^4. Nevertheless, this result confirms that these devices are capable of capture with beads in the size range of interest.
Next, we moved to using purified EVs obtained from the cell culture media of bladder cancer cells (5637 cell line). In the past we have used a prelabeling technique in which EVs are mixed with a general label (CFSE) prior to capture; this was carried out again and the results are shown below (Figure 5).
Once again we see successful capture, and perhaps more importantly, we do not see much aggregation even though we are carrying out dead-end filtration. Another appeal of the ALine devices was the well which could act as an incubation reservoir and provide access to captured EVs from the “clean side” of the membrane. We tried an array of in situ labeling strategies in an effort to reduce potential background from CFSE, although labeling with both CFSE and an antibody from within the device proved to be difficult.
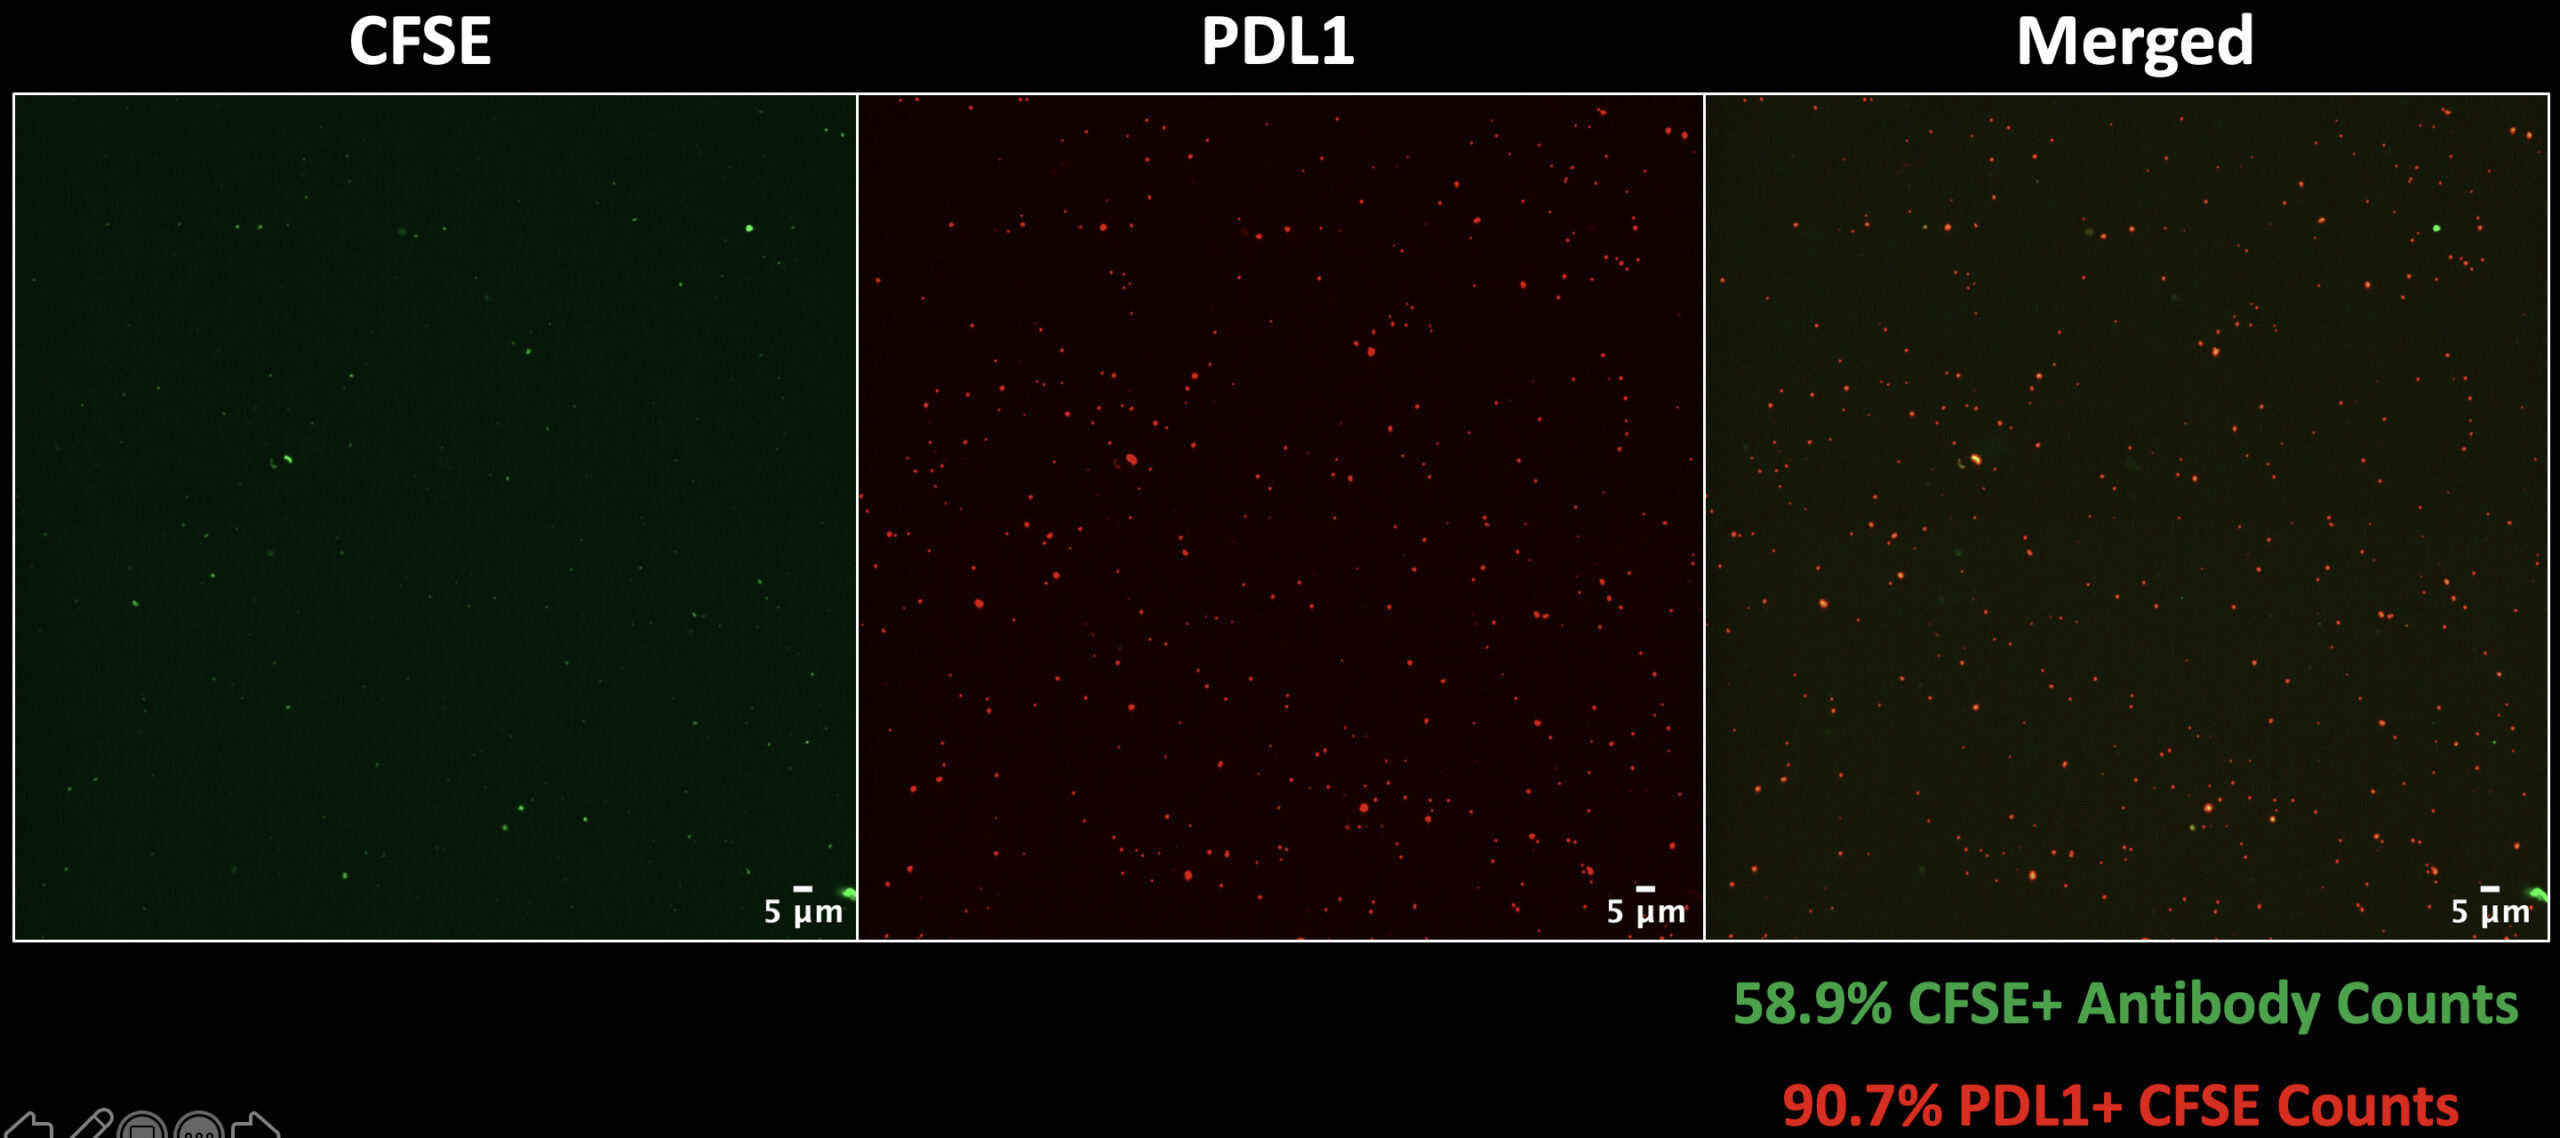
For this reason, our next step was to incorporate an antibody label with our general label using prelabeling for both. PD-L1 was the antibody of choice since we know PD-L1 is over-expressed in cases of cancer, and present on a higher proportion of 5637 EVs thanks to Kilean’s findings. The results from CFSE & PD-L1 prelabeling with 5637 EVs is shown below (Figure 6).
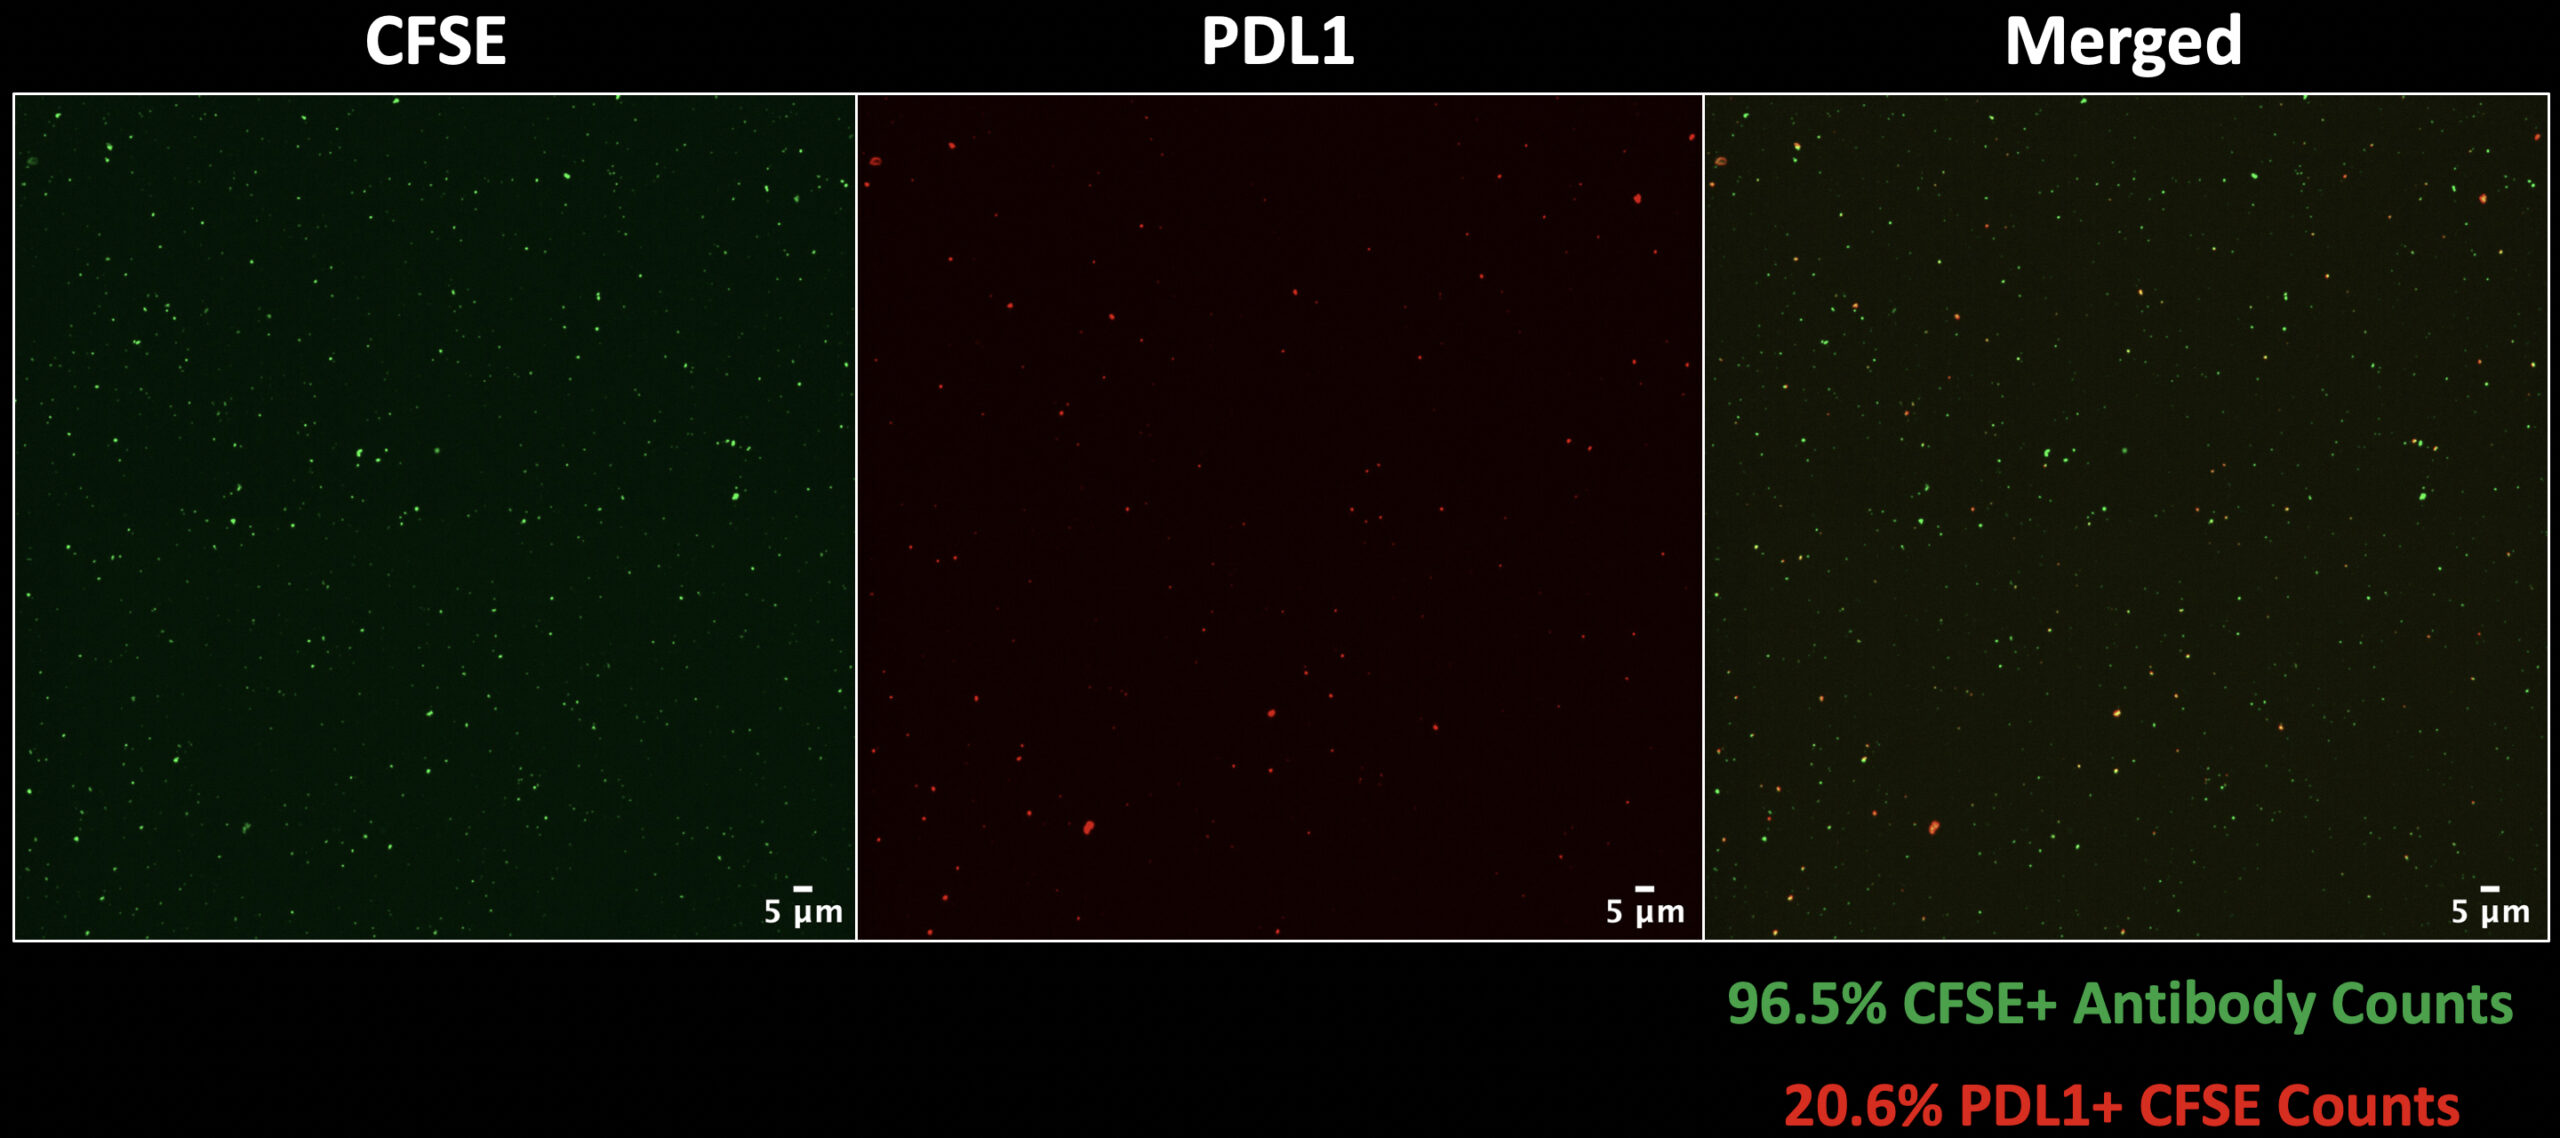
These results are encouraging for two reasons:
- The labeling efficiency (green percentage) is very high. This means that virtually every antibody signal is colocalized with a CFSE signal which suggests that there is very little background PD-L1 labeling.
- The percentage of PD-L1+ EVs (red percentage) is relatively high which is expected since these are EVs from a cancer cell line. This percentage also agrees with the previous values reported by Kilean.
The next image (Figure 7) shows the same experiment run in the absence of EVs, so only CFSE and PD-L1 antibody.
What we see is that there is still some CFSE signal and in this case actually more PD-L1 antibody signals, this likely due to the fact that free antibody is aggregating and being captured as it is focused through NPN pores. What is good news here is that there is ~70% reduction in CFSE counts and only about ~59% of antibody signals colocalize with our general label.
Knowing this we finally turned to plasma samples. The image shown below (Figure 8) is one of the first attempts at capturing plasma EVs in the ALine devices.
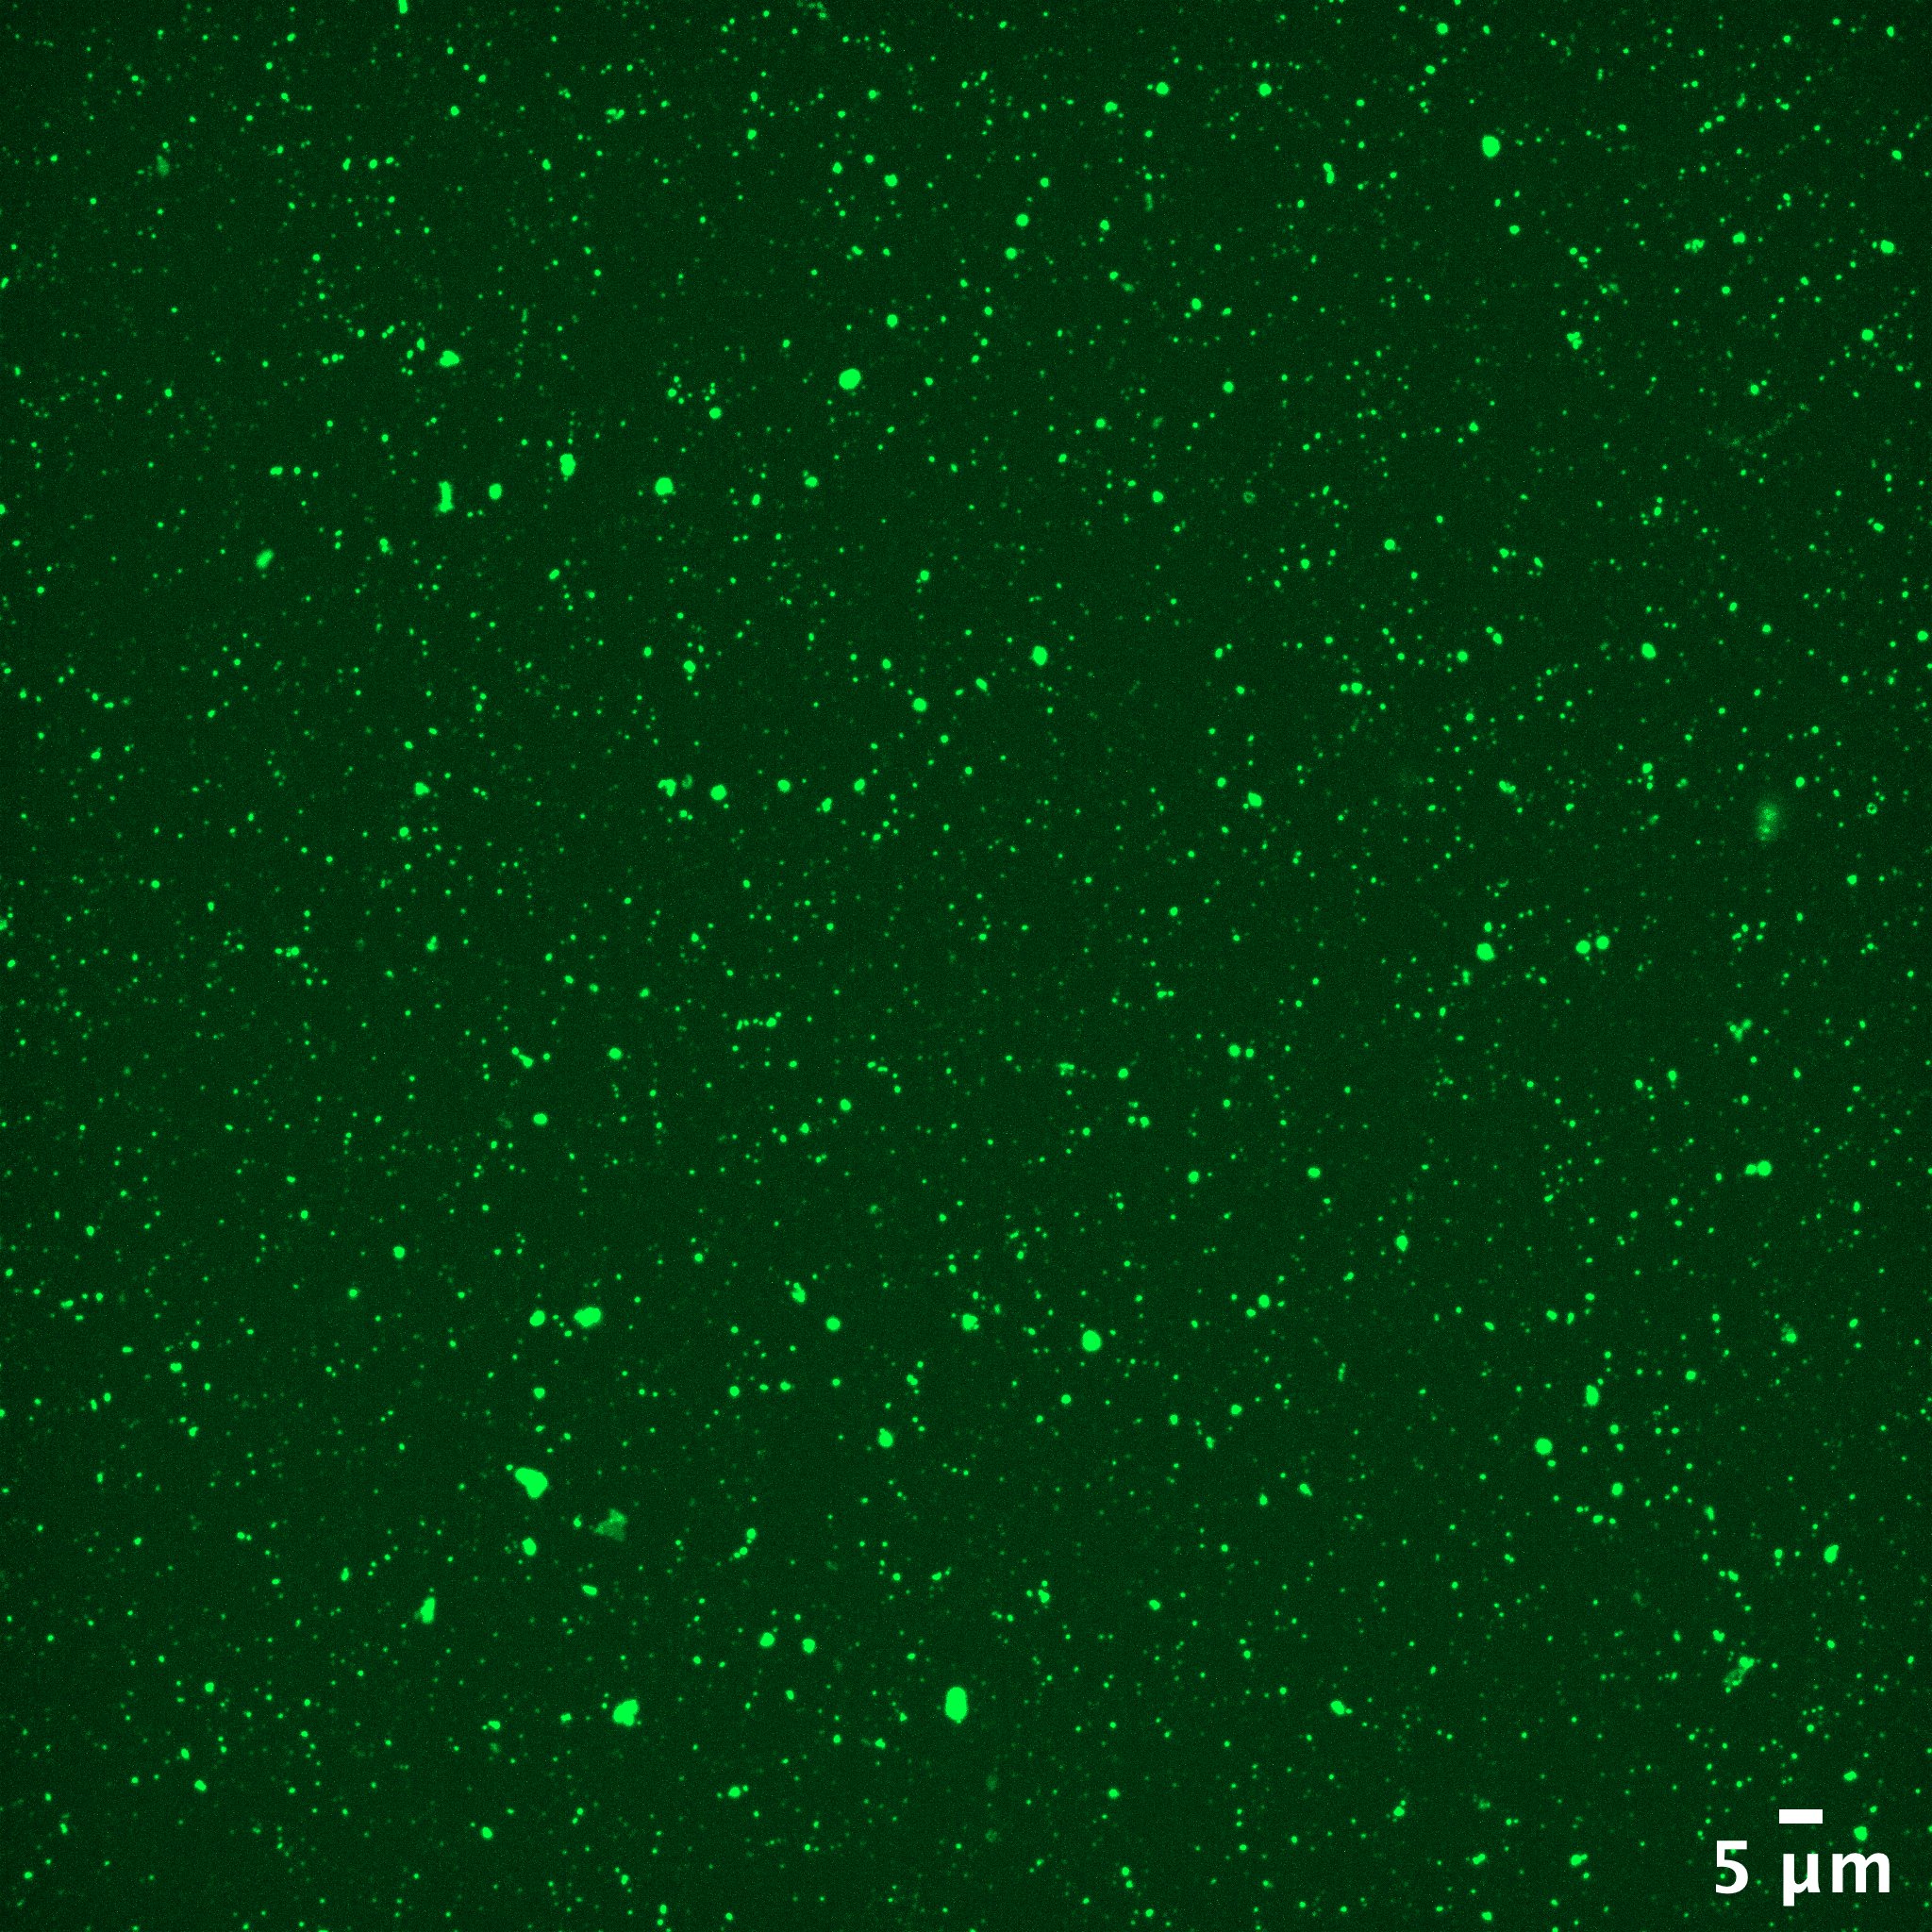
What we get is fairly nice capture with plenty of smaller/singlet signals. There are signals larger than a micron but I think some of these could be avoided by reducing the input concentration or simply incorporating a counting algorithm that ignores larger particles.
After all of this, I think we have shown the true potential of the ALine device in the realm of EV capture. We can use smaller input volumes, increase experiment throughput, and image membranes in devices providing more representative images depicting how EVs are actually captured. Moving forward we want to now incorporate antibody labeling with plasma samples and see if cancer/immune markers can differentiate healthy individuals from cancer patient samples.