Cellulose Separations
I set up separations with 100kD cutoff Microcon (cellulose) membranes and protein standards. Here are the results:

Due to shorter than normal gel, the myosin didn’t get resolved. However we can see a separation that appears to be fairly sharp. We have seen this in the past with cellulose. The different salt concentrations don’t appear to have much of an effect on the separations.
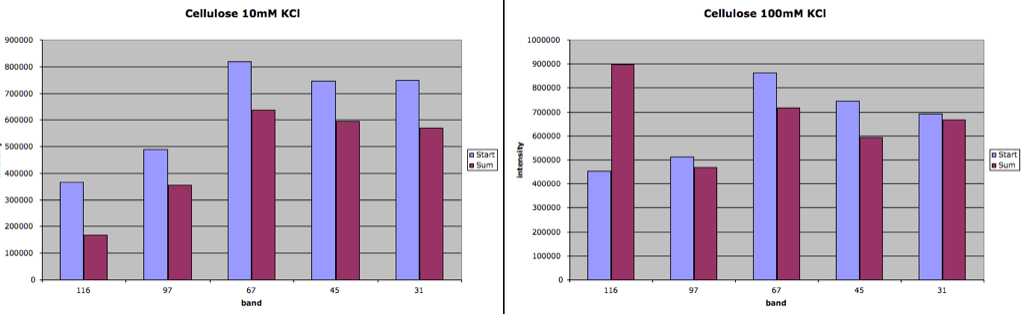
The following charts are to illustrate the loss or fouling of the membrane. In both cases, it seems much less is lost to the membrane as compared to PES. There is one very dark band at 100mM KCl 116kD that seems to be an anomoly. More repeats of this separation are next on the docket.
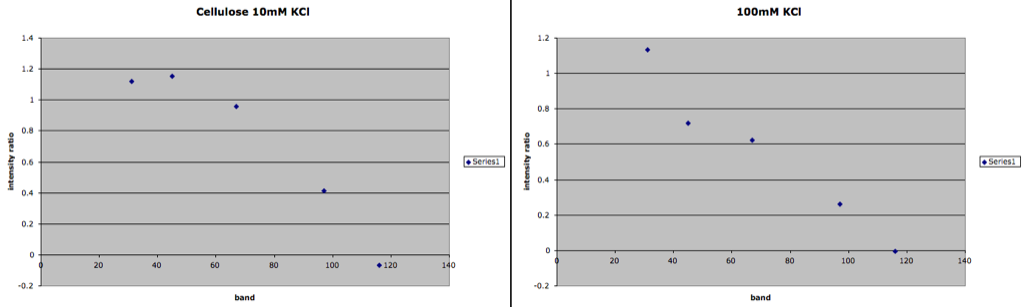
The following charts show the intensity ratio (or I(filtrate) / I(retentate), also called separation factor). The separations appear to be close, but it’s possible that the lower salt concentration has a slightly sharper separation. The zeta potential of this membrane may not be very high and in that case salt wouldn’t have that much of an effect.
I think we should see if a lower MWCO cellulose membrane is just as sharp. The native size differences of the molecules at the top of this ladder are pretty big, right? So sharpness is not a huge surprise. Now that our membranes have a couple of different cut-offs (depending on salt concentration), I think it is more fair to also look at the lower cut-off membranes.
Were these centrifuge separations or diffusion?
If centrifuge – how much fluid was passed?
If diffusion – how long were these run. Volumes?
Diffusion and same setup as the previous PES study. 20uL protein on top, 20uL buffer on bottom. 24 hour diffusion.